Blackfeet 2 or more Vehicles in Household

COMPARE

Blackfeet
Race
Ancestry
AfghanAfricanAlaska NativeAlaskan AthabascanAlbanianAleutAlsatianAmericanApacheArabArapahoArgentineanArmenianAssyrian/Chaldean/SyriacAustralianAustrianBahamianBangladeshiBarbadianBasqueBelgianBelizeanBermudanBhutaneseBlackfeetBolivianBrazilianBritishBritish West IndianBulgarianBurmeseCajunCambodianCanadianCape VerdeanCarpatho RusynCelticCentral AmericanCentral American IndianCherokeeCheyenneChickasawChileanChineseChippewaChoctawColombianColvilleComancheCosta RicanCreeCreekCroatianCrowCubanCypriotCzechCzechoslovakianDanishDelawareDominicanDutchDutch West IndianEastern EuropeanEcuadorianEgyptianEnglishEstonianEthiopianEuropeanFijianFilipinoFinnishFrenchFrench American IndianFrench CanadianGermanGerman RussianGhanaianGreekGuamanian/ChamorroGuatemalanGuyaneseHaitianHmongHonduranHopiHoumaHungarianIcelanderIndian (Asian)IndonesianInupiatIranianIraqiIrishIroquoisIsraeliItalianJamaicanJapaneseJordanianKenyanKiowaKoreanLaotianLatvianLebaneseLiberianLithuanianLumbeeLuxembourgerMacedonianMalaysianMalteseMarshalleseMenomineeMexicanMexican American IndianMongolianMoroccanNative HawaiianNavajoNepaleseNew ZealanderNicaraguanNigerianNorthern EuropeanNorwegianOkinawanOsageOttawaPaiutePakistaniPalestinianPanamanianParaguayanPennsylvania GermanPeruvianPimaPolishPortuguesePotawatomiPuebloPuerto RicanPuget Sound SalishRomanianRussianSalvadoranSamoanScandinavianScotch-IrishScottishSeminoleSenegaleseSerbianShoshoneSierra LeoneanSiouxSlavicSlovakSloveneSomaliSouth AfricanSouth AmericanSouth American IndianSoviet UnionSpaniardSpanishSpanish AmericanSpanish American IndianSri LankanSubsaharan AfricanSudaneseSwedishSwissSyrianTaiwaneseThaiTlingit-HaidaTohono O'OdhamTonganTrinidadian and TobagonianTsimshianTurkishU.S. Virgin IslanderUgandanUkrainianUruguayanUteVenezuelanVietnameseWelshWest IndianYakamaYaquiYugoslavianYumanYup'ikZimbabwean
Immigration
NonimmigrantsImmigrantsAfghanistanAfricaAlbaniaArgentinaArmeniaAsiaAustraliaAustriaBahamasBangladeshBarbadosBelarusBelgiumBelizeBoliviaBosnia and HerzegovinaBrazilBulgariaBurma/MyanmarCabo VerdeCambodiaCameroonCanadaCaribbeanCentral AmericaChileChinaColombiaCongoCosta RicaCroatiaCubaCzechoslovakiaDenmarkDominicaDominican RepublicEastern AfricaEastern AsiaEastern EuropeEcuadorEgyptEl SalvadorEnglandEritreaEthiopiaEuropeFijiFranceGermanyGhanaGreeceGrenadaGuatemalaGuyanaHaitiHondurasHong KongHungaryIndiaIndonesiaIranIraqIrelandIsraelItalyJamaicaJapanJordanKazakhstanKenyaKoreaKuwaitLaosLatin AmericaLatviaLebanonLiberiaLithuaniaMalaysiaMexicoMicronesiaMiddle AfricaMoldovaMoroccoNepalNetherlandsNicaraguaNigeriaNorth AmericaNorth MacedoniaNorthern AfricaNorthern EuropeNorwayOceaniaPakistanPanamaPeruPhilippinesPolandPortugalRomaniaRussiaSaudi ArabiaScotlandSenegalSerbiaSierra LeoneSingaporeSomaliaSouth AfricaSouth AmericaSouth Central AsiaSouth Eastern AsiaSouthern EuropeSpainSri LankaSt. Vincent and the GrenadinesSudanSwedenSwitzerlandSyriaTaiwanThailandTrinidad and TobagoTurkeyUgandaUkraineUruguayUzbekistanVenezuelaVietnamWest IndiesWestern AfricaWestern AsiaWestern EuropeYemenZaireZimbabweAzores
Select to Compare
Race
Ancestry
AfghanAfricanAlaska NativeAlaskan AthabascanAlbanianAleutAlsatianAmericanApacheArabArapahoArgentineanArmenianAssyrian/Chaldean/SyriacAustralianAustrianBahamianBangladeshiBarbadianBasqueBelgianBelizeanBermudanBhutaneseBolivianBrazilianBritishBritish West IndianBulgarianBurmeseCajunCambodianCanadianCape VerdeanCarpatho RusynCelticCentral AmericanCentral American IndianCherokeeCheyenneChickasawChileanChineseChippewaChoctawColombianColvilleComancheCosta RicanCreeCreekCroatianCrowCubanCypriotCzechCzechoslovakianDanishDelawareDominicanDutchDutch West IndianEastern EuropeanEcuadorianEgyptianEnglishEstonianEthiopianEuropeanFijianFilipinoFinnishFrenchFrench American IndianFrench CanadianGermanGerman RussianGhanaianGreekGuamanian/ChamorroGuatemalanGuyaneseHaitianHmongHonduranHopiHoumaHungarianIcelanderIndian (Asian)IndonesianInupiatIranianIraqiIrishIroquoisIsraeliItalianJamaicanJapaneseJordanianKenyanKiowaKoreanLaotianLatvianLebaneseLiberianLithuanianLumbeeLuxembourgerMacedonianMalaysianMalteseMarshalleseMenomineeMexicanMexican American IndianMongolianMoroccanNative HawaiianNavajoNepaleseNew ZealanderNicaraguanNigerianNorthern EuropeanNorwegianOkinawanOsageOttawaPaiutePakistaniPalestinianPanamanianParaguayanPennsylvania GermanPeruvianPimaPolishPortuguesePotawatomiPuebloPuerto RicanPuget Sound SalishRomanianRussianSalvadoranSamoanScandinavianScotch-IrishScottishSeminoleSenegaleseSerbianShoshoneSierra LeoneanSiouxSlavicSlovakSloveneSomaliSouth AfricanSouth AmericanSouth American IndianSoviet UnionSpaniardSpanishSpanish AmericanSpanish American IndianSri LankanSubsaharan AfricanSudaneseSwedishSwissSyrianTaiwaneseThaiTlingit-HaidaTohono O'OdhamTonganTrinidadian and TobagonianTsimshianTurkishU.S. Virgin IslanderUgandanUkrainianUruguayanUteVenezuelanVietnameseWelshWest IndianYakamaYaquiYugoslavianYumanYup'ikZimbabwean
Immigration
NonimmigrantsImmigrantsAfghanistanAfricaAlbaniaArgentinaArmeniaAsiaAustraliaAustriaBahamasBangladeshBarbadosBelarusBelgiumBelizeBoliviaBosnia and HerzegovinaBrazilBulgariaBurma/MyanmarCabo VerdeCambodiaCameroonCanadaCaribbeanCentral AmericaChileChinaColombiaCongoCosta RicaCroatiaCubaCzechoslovakiaDenmarkDominicaDominican RepublicEastern AfricaEastern AsiaEastern EuropeEcuadorEgyptEl SalvadorEnglandEritreaEthiopiaEuropeFijiFranceGermanyGhanaGreeceGrenadaGuatemalaGuyanaHaitiHondurasHong KongHungaryIndiaIndonesiaIranIraqIrelandIsraelItalyJamaicaJapanJordanKazakhstanKenyaKoreaKuwaitLaosLatin AmericaLatviaLebanonLiberiaLithuaniaMalaysiaMexicoMicronesiaMiddle AfricaMoldovaMoroccoNepalNetherlandsNicaraguaNigeriaNorth AmericaNorth MacedoniaNorthern AfricaNorthern EuropeNorwayOceaniaPakistanPanamaPeruPhilippinesPolandPortugalRomaniaRussiaSaudi ArabiaScotlandSenegalSerbiaSierra LeoneSingaporeSomaliaSouth AfricaSouth AmericaSouth Central AsiaSouth Eastern AsiaSouthern EuropeSpainSri LankaSt. Vincent and the GrenadinesSudanSwedenSwitzerlandSyriaTaiwanThailandTrinidad and TobagoTurkeyUgandaUkraineUruguayUzbekistanVenezuelaVietnamWest IndiesWestern AfricaWestern AsiaWestern EuropeYemenZaireZimbabweAzores
2 or more Vehicles in Household
Income
Poverty
Unemployment
Labor Participation
Family Structure
Vehicle Availability
Education Level
Disability

Blackfeet 2 or more Vehicles in Household
Excellent

56.4%
2+ VEHICLES AVAILABLE
86.5/ 100
METRIC RATING
135th/ 347
METRIC RANK

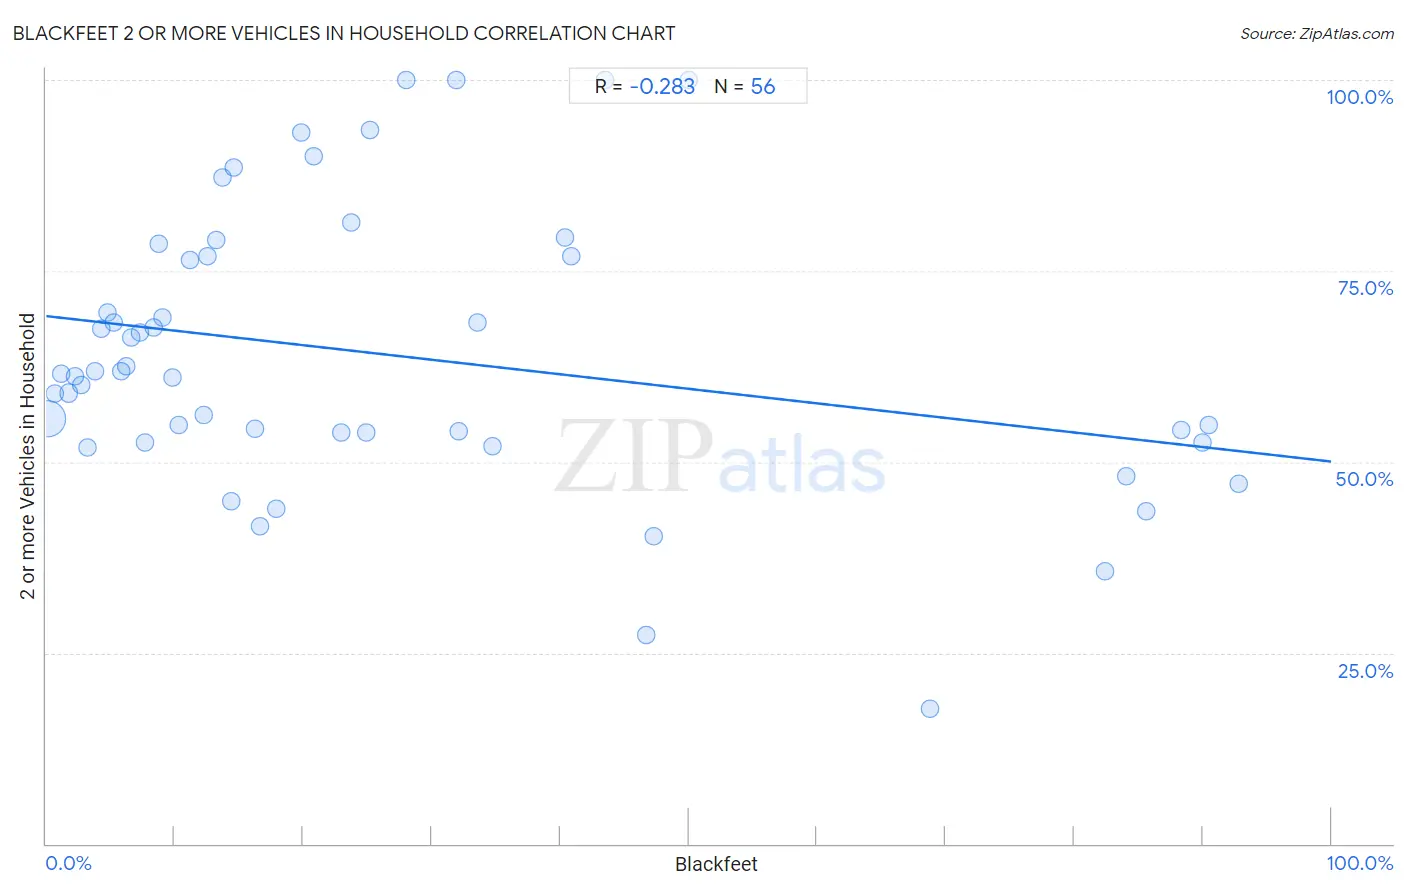
Blackfeet 2 or more Vehicles in Household Correlation Chart

The statistical analysis conducted on geographies consisting of 309,483,449 people shows a weak negative correlation between the proportion of Blackfeet and percentage of households with 2 or more vehicles available in the United States with a correlation coefficient (R) of -0.283 and weighted average of 56.4%. On average, for every 1% (one percent) increase in Blackfeet within a typical geography, there is a decrease of 0.19% in percentage of households with 2 or more vehicles available.
Blackfeet 2 or more Vehicles in Household
It is essential to understand that the correlation between the percentage of Blackfeet and percentage of households with 2 or more vehicles available does not imply a direct cause-and-effect relationship. It remains uncertain whether the presence of Blackfeet influences an upward or downward trend in the level of percentage of households with 2 or more vehicles available within an area, or if Blackfeet simply ended up residing in those areas with higher or lower levels of percentage of households with 2 or more vehicles available due to other factors.

Demographics Similar to Blackfeet by 2 or more Vehicles in Household

In terms of 2 or more vehicles in household, the demographic groups most similar to Blackfeet are Immigrants from the Azores (56.4%, a difference of 0.010%), Immigrants from Asia (56.3%, a difference of 0.040%), Cuban (56.3%, a difference of 0.13%), Salvadoran (56.3%, a difference of 0.14%), and Comanche (56.5%, a difference of 0.16%).
DemographicsRating | Rank2 or more Vehicles in Household
Immigrants from South Central Asia
90.5
/100
|
#128
Exceptional
56.6%
Ute
90.4
/100
|
#129
Exceptional
56.6%
Yugoslavians
90.0
/100
|
#130
Exceptional
56.6%
Bulgarians
89.7
/100
|
#131
Excellent
56.5%
Hungarians
89.1
/100
|
#132
Excellent
56.5%
Comanche
88.4
/100
|
#133
Excellent
56.5%
Immigrants from the Azores
86.6
/100
|
#134
Excellent
56.4%
Blackfeet
86.5
/100
|
#135
Excellent
56.4%
Immigrants from Asia
86.0
/100
|
#136
Excellent
56.3%
Cubans
84.8
/100
|
#137
Excellent
56.3%
Salvadorans
84.7
/100
|
#138
Excellent
56.3%
Armenians
84.3
/100
|
#139
Excellent
56.3%
Latvians
83.6
/100
|
#140
Excellent
56.2%
Immigrants from Cambodia
83.6
/100
|
#141
Excellent
56.2%
South Africans
83.1
/100
|
#142
Excellent
56.2%

Blackfeet 2 or more Vehicles in Household Correlation Summary

MeasurementBlackfeet Data2 or more Vehicles in Household Data
Minimum0.088%17.6%
Maximum92.8%100.0%
Range92.7%82.4%
Mean26.8%64.0%
Median15.4%61.3%
Interquartile 25% (IQ1)7.0%53.2%
Interquartile 75% (IQ3)37.6%76.8%
Interquartile Range (IQR)30.6%23.7%
Standard Deviation (Sample)27.5%18.5%
Standard Deviation (Population)27.3%18.3%

Correlation Details

Blackfeet PercentileSample Size2 or more Vehicles in Household
[
0.0%
-
0.5%
]
0.088%
300,765,82655.6%
[
0.5%
-
1.0%
]
0.68%
6,545,85959.0%
[
1.0%
-
1.5%
]
1.21%
989,41061.5%
[
1.5%
-
2.0%
]
1.73%
683,70059.0%
[
2.0%
-
2.5%
]
2.20%
216,63761.2%
[
2.5%
-
3.0%
]
2.69%
76,20960.0%
[
3.0%
-
3.5%
]
3.23%
47,11751.9%
[
3.5%
-
4.0%
]
3.76%
28,98161.9%
[
4.0%
-
4.5%
]
4.26%
32,82967.5%
[
4.5%
-
5.0%
]
4.72%
8,30469.6%
[
5.0%
-
5.5%
]
5.29%
8,28368.2%
[
5.5%
-
6.0%
]
5.82%
14,93361.9%
[
6.0%
-
6.5%
]
6.26%
9,66362.5%
[
6.5%
-
7.0%
]
6.64%
5,10766.4%
[
7.0%
-
7.5%
]
7.26%
4,21367.0%
[
7.5%
-
8.0%
]
7.67%
4,08152.6%
[
8.0%
-
8.5%
]
8.39%
3,13667.5%
[
8.5%
-
9.0%
]
8.80%
2,14878.6%
[
9.0%
-
9.5%
]
9.07%
37569.0%
[
9.5%
-
10.0%
]
9.78%
1,08461.0%
[
10.0%
-
10.5%
]
10.32%
85354.8%
[
11.0%
-
11.5%
]
11.19%
2,53876.5%
[
12.0%
-
12.5%
]
12.24%
14756.2%
[
12.5%
-
13.0%
]
12.58%
1,24076.8%
[
13.0%
-
13.5%
]
13.20%
19779.1%
[
13.5%
-
14.0%
]
13.72%
86087.2%
[
14.0%
-
14.5%
]
14.37%
16744.9%
[
14.5%
-
15.0%
]
14.58%
24088.5%
[
16.0%
-
16.5%
]
16.28%
1,25354.4%
[
16.5%
-
17.0%
]
16.67%
53441.6%
[
17.5%
-
18.0%
]
17.94%
3,06143.8%
[
19.5%
-
20.0%
]
19.83%
11693.2%
[
20.5%
-
21.0%
]
20.83%
12090.0%
[
22.5%
-
23.0%
]
22.98%
5,00853.9%
[
23.5%
-
24.0%
]
23.75%
48081.3%
[
24.5%
-
25.0%
]
24.88%
41453.8%
[
25.0%
-
25.5%
]
25.15%
16393.4%
[
28.0%
-
28.5%
]
28.00%
50100.0%
[
31.5%
-
32.0%
]
31.95%
241100.0%
[
32.0%
-
32.5%
]
32.07%
34353.9%
[
33.5%
-
34.0%
]
33.61%
24468.3%
[
34.5%
-
35.0%
]
34.78%
1,31752.1%
[
40.0%
-
40.5%
]
40.40%
15179.4%
[
40.5%
-
41.0%
]
40.90%
86376.8%
[
43.0%
-
43.5%
]
43.48%
69100.0%
[
46.5%
-
47.0%
]
46.67%
1527.3%
[
47.0%
-
47.5%
]
47.23%
27140.3%
[
50.0%
-
50.5%
]
50.00%
4100.0%
[
68.5%
-
69.0%
]
68.75%
6417.6%
[
82.0%
-
82.5%
]
82.35%
1,65435.7%
[
84.0%
-
84.5%
]
84.09%
7,53248.1%
[
85.5%
-
86.0%
]
85.65%
87143.6%
[
88.0%
-
88.5%
]
88.34%
3,00154.1%
[
89.5%
-
90.0%
]
89.96%
22952.5%
[
90.0%
-
90.5%
]
90.43%
69054.8%
[
92.5%
-
93.0%
]
92.78%
55447.2%