Blackfeet College, 1 year or more

COMPARE

Blackfeet
Race
Ancestry
AfghanAfricanAlaska NativeAlaskan AthabascanAlbanianAleutAlsatianAmericanApacheArabArapahoArgentineanArmenianAssyrian/Chaldean/SyriacAustralianAustrianBahamianBangladeshiBarbadianBasqueBelgianBelizeanBermudanBhutaneseBlackfeetBolivianBrazilianBritishBritish West IndianBulgarianBurmeseCajunCambodianCanadianCape VerdeanCarpatho RusynCelticCentral AmericanCentral American IndianCherokeeCheyenneChickasawChileanChineseChippewaChoctawColombianColvilleComancheCosta RicanCreeCreekCroatianCrowCubanCypriotCzechCzechoslovakianDanishDelawareDominicanDutchDutch West IndianEastern EuropeanEcuadorianEgyptianEnglishEstonianEthiopianEuropeanFijianFilipinoFinnishFrenchFrench American IndianFrench CanadianGermanGerman RussianGhanaianGreekGuamanian/ChamorroGuatemalanGuyaneseHaitianHmongHonduranHopiHoumaHungarianIcelanderIndian (Asian)IndonesianInupiatIranianIraqiIrishIroquoisIsraeliItalianJamaicanJapaneseJordanianKenyanKiowaKoreanLaotianLatvianLebaneseLiberianLithuanianLumbeeLuxembourgerMacedonianMalaysianMalteseMarshalleseMenomineeMexicanMexican American IndianMongolianMoroccanNative HawaiianNavajoNepaleseNew ZealanderNicaraguanNigerianNorthern EuropeanNorwegianOkinawanOsageOttawaPaiutePakistaniPalestinianPanamanianParaguayanPennsylvania GermanPeruvianPimaPolishPortuguesePotawatomiPuebloPuerto RicanPuget Sound SalishRomanianRussianSalvadoranSamoanScandinavianScotch-IrishScottishSeminoleSenegaleseSerbianShoshoneSierra LeoneanSiouxSlavicSlovakSloveneSomaliSouth AfricanSouth AmericanSouth American IndianSoviet UnionSpaniardSpanishSpanish AmericanSpanish American IndianSri LankanSubsaharan AfricanSudaneseSwedishSwissSyrianTaiwaneseThaiTlingit-HaidaTohono O'OdhamTonganTrinidadian and TobagonianTsimshianTurkishU.S. Virgin IslanderUgandanUkrainianUruguayanUteVenezuelanVietnameseWelshWest IndianYakamaYaquiYugoslavianYumanYup'ikZimbabwean
Immigration
NonimmigrantsImmigrantsAfghanistanAfricaAlbaniaArgentinaArmeniaAsiaAustraliaAustriaBahamasBangladeshBarbadosBelarusBelgiumBelizeBoliviaBosnia and HerzegovinaBrazilBulgariaBurma/MyanmarCabo VerdeCambodiaCameroonCanadaCaribbeanCentral AmericaChileChinaColombiaCongoCosta RicaCroatiaCubaCzechoslovakiaDenmarkDominicaDominican RepublicEastern AfricaEastern AsiaEastern EuropeEcuadorEgyptEl SalvadorEnglandEritreaEthiopiaEuropeFijiFranceGermanyGhanaGreeceGrenadaGuatemalaGuyanaHaitiHondurasHong KongHungaryIndiaIndonesiaIranIraqIrelandIsraelItalyJamaicaJapanJordanKazakhstanKenyaKoreaKuwaitLaosLatin AmericaLatviaLebanonLiberiaLithuaniaMalaysiaMexicoMicronesiaMiddle AfricaMoldovaMoroccoNepalNetherlandsNicaraguaNigeriaNorth AmericaNorth MacedoniaNorthern AfricaNorthern EuropeNorwayOceaniaPakistanPanamaPeruPhilippinesPolandPortugalRomaniaRussiaSaudi ArabiaScotlandSenegalSerbiaSierra LeoneSingaporeSomaliaSouth AfricaSouth AmericaSouth Central AsiaSouth Eastern AsiaSouthern EuropeSpainSri LankaSt. Vincent and the GrenadinesSudanSwedenSwitzerlandSyriaTaiwanThailandTrinidad and TobagoTurkeyUgandaUkraineUruguayUzbekistanVenezuelaVietnamWest IndiesWestern AfricaWestern AsiaWestern EuropeYemenZaireZimbabweAzores
Select to Compare
Race
Ancestry
AfghanAfricanAlaska NativeAlaskan AthabascanAlbanianAleutAlsatianAmericanApacheArabArapahoArgentineanArmenianAssyrian/Chaldean/SyriacAustralianAustrianBahamianBangladeshiBarbadianBasqueBelgianBelizeanBermudanBhutaneseBolivianBrazilianBritishBritish West IndianBulgarianBurmeseCajunCambodianCanadianCape VerdeanCarpatho RusynCelticCentral AmericanCentral American IndianCherokeeCheyenneChickasawChileanChineseChippewaChoctawColombianColvilleComancheCosta RicanCreeCreekCroatianCrowCubanCypriotCzechCzechoslovakianDanishDelawareDominicanDutchDutch West IndianEastern EuropeanEcuadorianEgyptianEnglishEstonianEthiopianEuropeanFijianFilipinoFinnishFrenchFrench American IndianFrench CanadianGermanGerman RussianGhanaianGreekGuamanian/ChamorroGuatemalanGuyaneseHaitianHmongHonduranHopiHoumaHungarianIcelanderIndian (Asian)IndonesianInupiatIranianIraqiIrishIroquoisIsraeliItalianJamaicanJapaneseJordanianKenyanKiowaKoreanLaotianLatvianLebaneseLiberianLithuanianLumbeeLuxembourgerMacedonianMalaysianMalteseMarshalleseMenomineeMexicanMexican American IndianMongolianMoroccanNative HawaiianNavajoNepaleseNew ZealanderNicaraguanNigerianNorthern EuropeanNorwegianOkinawanOsageOttawaPaiutePakistaniPalestinianPanamanianParaguayanPennsylvania GermanPeruvianPimaPolishPortuguesePotawatomiPuebloPuerto RicanPuget Sound SalishRomanianRussianSalvadoranSamoanScandinavianScotch-IrishScottishSeminoleSenegaleseSerbianShoshoneSierra LeoneanSiouxSlavicSlovakSloveneSomaliSouth AfricanSouth AmericanSouth American IndianSoviet UnionSpaniardSpanishSpanish AmericanSpanish American IndianSri LankanSubsaharan AfricanSudaneseSwedishSwissSyrianTaiwaneseThaiTlingit-HaidaTohono O'OdhamTonganTrinidadian and TobagonianTsimshianTurkishU.S. Virgin IslanderUgandanUkrainianUruguayanUteVenezuelanVietnameseWelshWest IndianYakamaYaquiYugoslavianYumanYup'ikZimbabwean
Immigration
NonimmigrantsImmigrantsAfghanistanAfricaAlbaniaArgentinaArmeniaAsiaAustraliaAustriaBahamasBangladeshBarbadosBelarusBelgiumBelizeBoliviaBosnia and HerzegovinaBrazilBulgariaBurma/MyanmarCabo VerdeCambodiaCameroonCanadaCaribbeanCentral AmericaChileChinaColombiaCongoCosta RicaCroatiaCubaCzechoslovakiaDenmarkDominicaDominican RepublicEastern AfricaEastern AsiaEastern EuropeEcuadorEgyptEl SalvadorEnglandEritreaEthiopiaEuropeFijiFranceGermanyGhanaGreeceGrenadaGuatemalaGuyanaHaitiHondurasHong KongHungaryIndiaIndonesiaIranIraqIrelandIsraelItalyJamaicaJapanJordanKazakhstanKenyaKoreaKuwaitLaosLatin AmericaLatviaLebanonLiberiaLithuaniaMalaysiaMexicoMicronesiaMiddle AfricaMoldovaMoroccoNepalNetherlandsNicaraguaNigeriaNorth AmericaNorth MacedoniaNorthern AfricaNorthern EuropeNorwayOceaniaPakistanPanamaPeruPhilippinesPolandPortugalRomaniaRussiaSaudi ArabiaScotlandSenegalSerbiaSierra LeoneSingaporeSomaliaSouth AfricaSouth AmericaSouth Central AsiaSouth Eastern AsiaSouthern EuropeSpainSri LankaSt. Vincent and the GrenadinesSudanSwedenSwitzerlandSyriaTaiwanThailandTrinidad and TobagoTurkeyUgandaUkraineUruguayUzbekistanVenezuelaVietnamWest IndiesWestern AfricaWestern AsiaWestern EuropeYemenZaireZimbabweAzores
College, 1 year or more
Income
Poverty
Unemployment
Labor Participation
Family Structure
Vehicle Availability
Education Level
Disability

Blackfeet College, 1 year or more
Tragic

54.6%
COLLEGE, 1 YEAR OR MORE
0.2/ 100
METRIC RATING
267th/ 347
METRIC RANK

Blackfeet College, 1 year or more Correlation Chart

The statistical analysis conducted on geographies consisting of 309,581,710 people shows a mild positive correlation between the proportion of Blackfeet and percentage of population with at least college, 1 year or more education in the United States with a correlation coefficient (R) of 0.318 and weighted average of 54.6%. On average, for every 1% (one percent) increase in Blackfeet within a typical geography, there is an increase of 0.16% in percentage of population with at least college, 1 year or more education.
Blackfeet College, 1 year or more
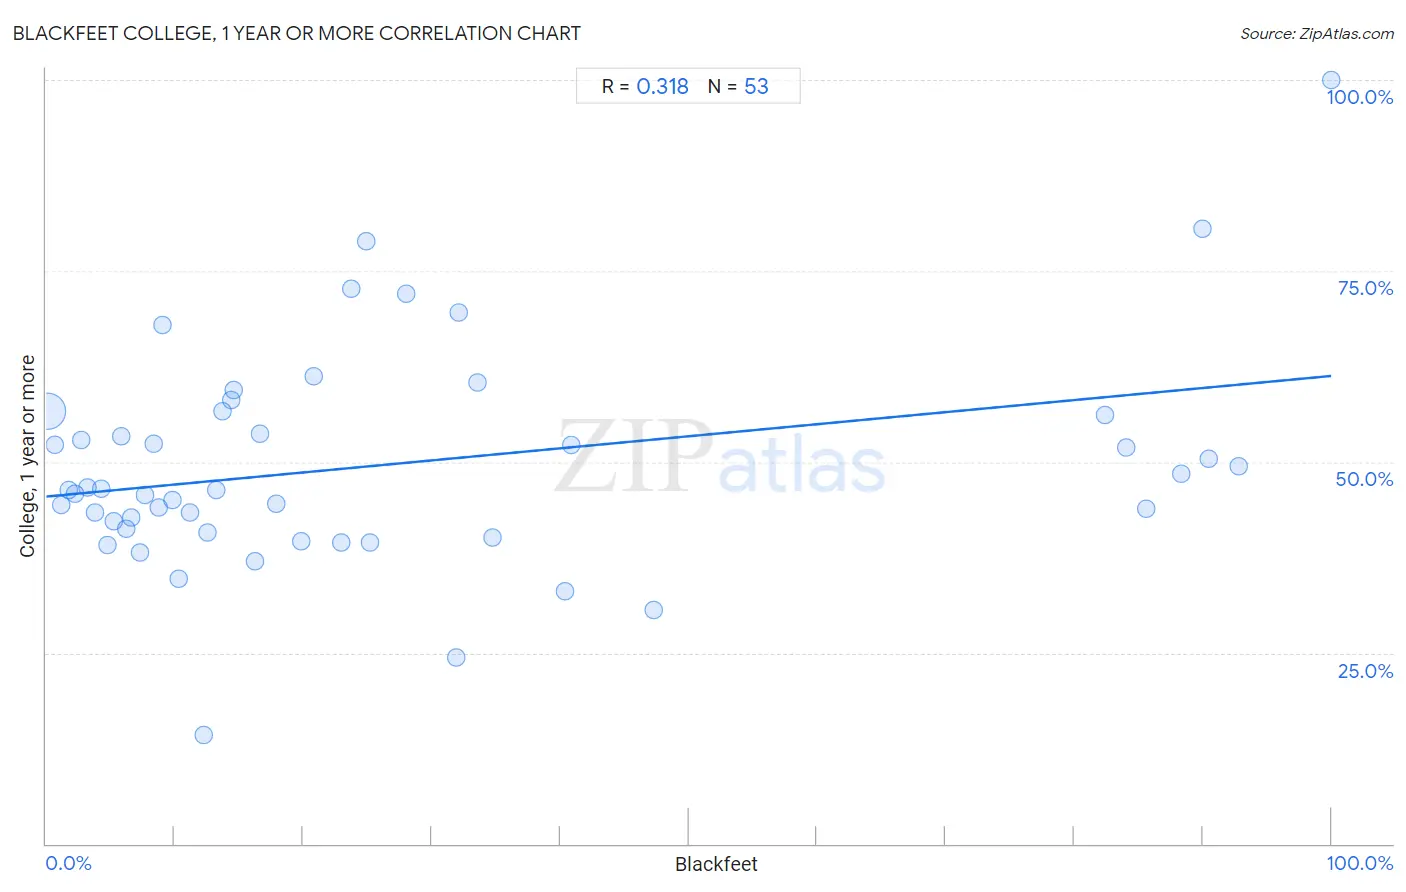
It is essential to understand that the correlation between the percentage of Blackfeet and percentage of population with at least college, 1 year or more education does not imply a direct cause-and-effect relationship. It remains uncertain whether the presence of Blackfeet influences an upward or downward trend in the level of percentage of population with at least college, 1 year or more education within an area, or if Blackfeet simply ended up residing in those areas with higher or lower levels of percentage of population with at least college, 1 year or more education due to other factors.

Demographics Similar to Blackfeet by College, 1 year or more

In terms of college, 1 year or more, the demographic groups most similar to Blackfeet are Potawatomi (54.6%, a difference of 0.070%), Immigrants from Laos (54.7%, a difference of 0.12%), British West Indian (54.5%, a difference of 0.16%), Bangladeshi (54.5%, a difference of 0.19%), and Crow (54.5%, a difference of 0.22%).
DemographicsRating | RankCollege, 1 year or more
Jamaicans
0.3
/100
|
#260
Tragic
54.9%
Ottawa
0.3
/100
|
#261
Tragic
54.9%
Immigrants from St. Vincent and the Grenadines
0.3
/100
|
#262
Tragic
54.8%
U.S. Virgin Islanders
0.3
/100
|
#263
Tragic
54.8%
Immigrants from Micronesia
0.3
/100
|
#264
Tragic
54.8%
Immigrants from Laos
0.2
/100
|
#265
Tragic
54.7%
Potawatomi
0.2
/100
|
#266
Tragic
54.6%
Blackfeet
0.2
/100
|
#267
Tragic
54.6%
British West Indians
0.2
/100
|
#268
Tragic
54.5%
Bangladeshis
0.2
/100
|
#269
Tragic
54.5%
Crow
0.2
/100
|
#270
Tragic
54.5%
Bahamians
0.2
/100
|
#271
Tragic
54.5%
Comanche
0.2
/100
|
#272
Tragic
54.4%
Immigrants from Grenada
0.2
/100
|
#273
Tragic
54.4%
Belizeans
0.2
/100
|
#274
Tragic
54.4%

Blackfeet College, 1 year or more Correlation Summary

MeasurementBlackfeet DataCollege, 1 year or more Data
Minimum0.088%14.2%
Maximum100.0%100.0%
Range99.9%85.8%
Mean26.3%49.6%
Median14.4%46.3%
Interquartile 25% (IQ1)6.4%40.9%
Interquartile 75% (IQ3)32.8%56.4%
Interquartile Range (IQR)26.4%15.4%
Standard Deviation (Sample)29.1%14.4%
Standard Deviation (Population)28.8%14.3%

Correlation Details

Blackfeet PercentileSample SizeCollege, 1 year or more
[
0.0%
-
0.5%
]
0.088%
300,855,53656.6%
[
0.5%
-
1.0%
]
0.68%
6,548,17752.3%
[
1.0%
-
1.5%
]
1.21%
993,98244.4%
[
1.5%
-
2.0%
]
1.73%
684,21546.3%
[
2.0%
-
2.5%
]
2.20%
216,63745.8%
[
2.5%
-
3.0%
]
2.69%
76,20952.9%
[
3.0%
-
3.5%
]
3.23%
47,11746.6%
[
3.5%
-
4.0%
]
3.76%
30,08043.4%
[
4.0%
-
4.5%
]
4.26%
32,82946.5%
[
4.5%
-
5.0%
]
4.72%
8,30439.1%
[
5.0%
-
5.5%
]
5.29%
8,42942.3%
[
5.5%
-
6.0%
]
5.82%
14,93353.4%
[
6.0%
-
6.5%
]
6.26%
9,64741.2%
[
6.5%
-
7.0%
]
6.64%
5,10742.6%
[
7.0%
-
7.5%
]
7.26%
4,14438.1%
[
7.5%
-
8.0%
]
7.67%
4,08145.7%
[
8.0%
-
8.5%
]
8.39%
3,13652.4%
[
8.5%
-
9.0%
]
8.80%
2,14844.0%
[
9.0%
-
9.5%
]
9.07%
37568.0%
[
9.5%
-
10.0%
]
9.80%
1,32645.0%
[
10.0%
-
10.5%
]
10.32%
85334.7%
[
11.0%
-
11.5%
]
11.19%
2,53843.3%
[
12.0%
-
12.5%
]
12.24%
14714.2%
[
12.5%
-
13.0%
]
12.58%
1,24040.7%
[
13.0%
-
13.5%
]
13.20%
19746.3%
[
13.5%
-
14.0%
]
13.72%
86056.7%
[
14.0%
-
14.5%
]
14.37%
16758.2%
[
14.5%
-
15.0%
]
14.58%
24059.4%
[
16.0%
-
16.5%
]
16.28%
1,25337.0%
[
16.5%
-
17.0%
]
16.67%
53453.6%
[
17.5%
-
18.0%
]
17.94%
3,06144.5%
[
19.5%
-
20.0%
]
19.83%
11639.5%
[
20.5%
-
21.0%
]
20.83%
12061.2%
[
22.5%
-
23.0%
]
22.98%
5,00839.4%
[
23.5%
-
24.0%
]
23.73%
35472.6%
[
24.5%
-
25.0%
]
24.88%
41478.9%
[
25.0%
-
25.5%
]
25.15%
16339.5%
[
28.0%
-
28.5%
]
28.00%
5072.0%
[
31.5%
-
32.0%
]
31.95%
24124.4%
[
32.0%
-
32.5%
]
32.07%
34369.5%
[
33.5%
-
34.0%
]
33.61%
24460.4%
[
34.5%
-
35.0%
]
34.78%
1,31740.0%
[
40.0%
-
40.5%
]
40.40%
15133.0%
[
40.5%
-
41.0%
]
40.90%
86352.1%
[
47.0%
-
47.5%
]
47.23%
27130.5%
[
82.0%
-
82.5%
]
82.35%
1,65456.1%
[
84.0%
-
84.5%
]
84.09%
7,53251.8%
[
85.5%
-
86.0%
]
85.65%
87143.8%
[
88.0%
-
88.5%
]
88.34%
3,00148.5%
[
89.5%
-
90.0%
]
89.96%
22980.6%
[
90.0%
-
90.5%
]
90.43%
69050.4%
[
92.5%
-
93.0%
]
92.78%
55449.5%
[
99.5%
-
100.0%
]
100.00%
22100.0%