Belizean Self-Care Disability
COMPARE
Belizean
Select to Compare
Self-Care Disability
Belizean Self-Care Disability
2.7%
SELF-CARE DISABILITY
0.0/ 100
METRIC RATING
293rd/ 347
METRIC RANK
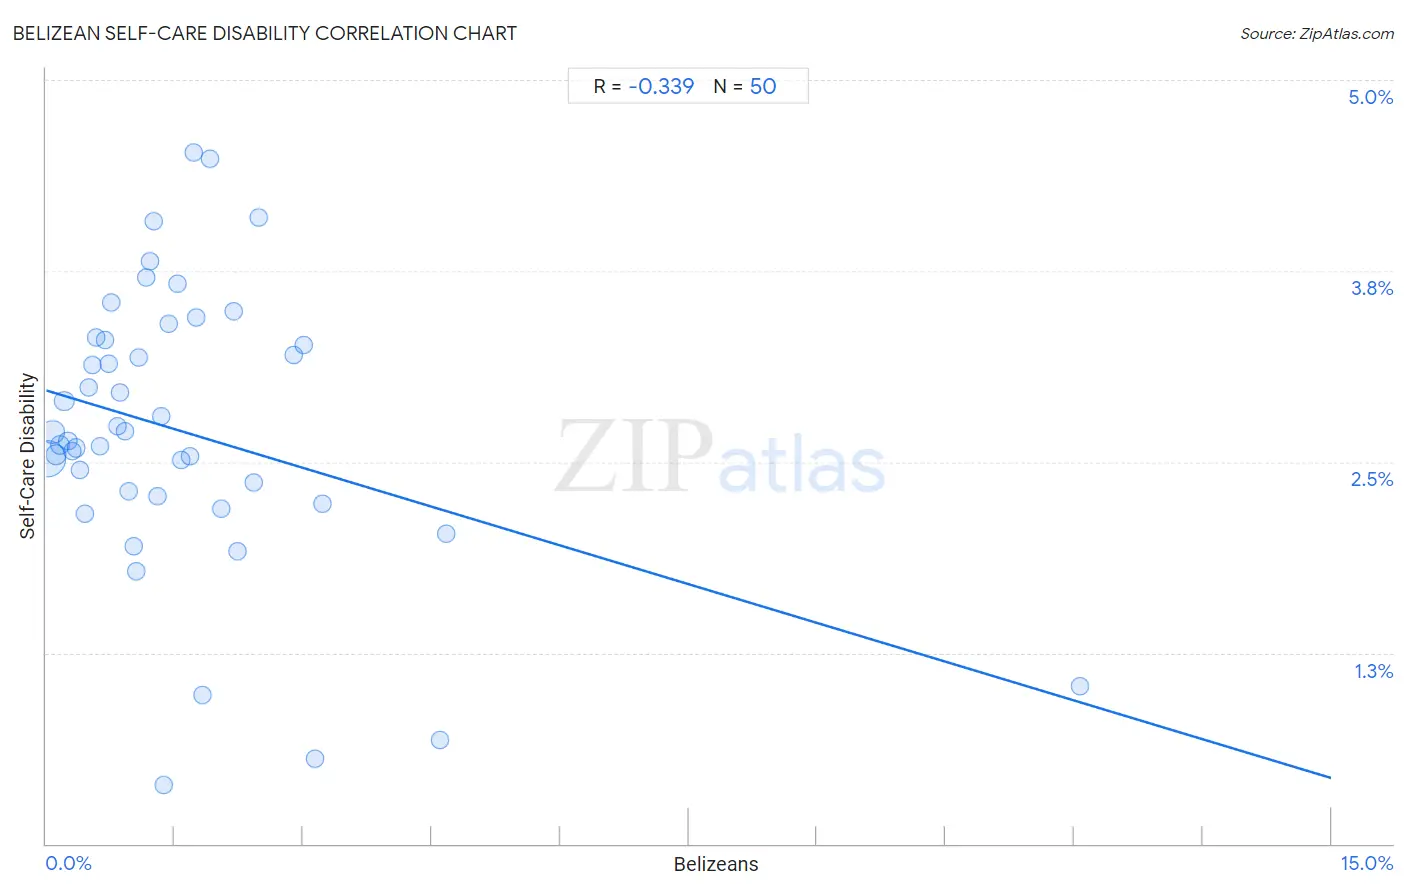
Belizean Self-Care Disability Correlation Chart
The statistical analysis conducted on geographies consisting of 144,103,033 people shows a mild negative correlation between the proportion of Belizeans and percentage of population with self-care disability in the United States with a correlation coefficient (R) of -0.339 and weighted average of 2.7%. On average, for every 1% (one percent) increase in Belizeans within a typical geography, there is a decrease of 0.17% in percentage of population with self-care disability.
It is essential to understand that the correlation between the percentage of Belizeans and percentage of population with self-care disability does not imply a direct cause-and-effect relationship. It remains uncertain whether the presence of Belizeans influences an upward or downward trend in the level of percentage of population with self-care disability within an area, or if Belizeans simply ended up residing in those areas with higher or lower levels of percentage of population with self-care disability due to other factors.
Demographics Similar to Belizeans by Self-Care Disability
In terms of self-care disability, the demographic groups most similar to Belizeans are Central American Indian (2.7%, a difference of 0.0%), Blackfeet (2.7%, a difference of 0.010%), Barbadian (2.7%, a difference of 0.15%), Guyanese (2.7%, a difference of 0.16%), and Cuban (2.7%, a difference of 0.42%).
| Demographics | Rating | Rank | Self-Care Disability |
| French American Indians | 0.0 /100 | #286 | Tragic 2.7% |
| Immigrants from Jamaica | 0.0 /100 | #287 | Tragic 2.7% |
| Immigrants from Barbados | 0.0 /100 | #288 | Tragic 2.7% |
| Africans | 0.0 /100 | #289 | Tragic 2.7% |
| Cubans | 0.0 /100 | #290 | Tragic 2.7% |
| Guyanese | 0.0 /100 | #291 | Tragic 2.7% |
| Central American Indians | 0.0 /100 | #292 | Tragic 2.7% |
| Belizeans | 0.0 /100 | #293 | Tragic 2.7% |
| Blackfeet | 0.0 /100 | #294 | Tragic 2.7% |
| Barbadians | 0.0 /100 | #295 | Tragic 2.7% |
| Immigrants from Portugal | 0.0 /100 | #296 | Tragic 2.8% |
| West Indians | 0.0 /100 | #297 | Tragic 2.8% |
| Americans | 0.0 /100 | #298 | Tragic 2.8% |
| Immigrants from Guyana | 0.0 /100 | #299 | Tragic 2.8% |
| Immigrants from Fiji | 0.0 /100 | #300 | Tragic 2.8% |
Belizean Self-Care Disability Correlation Summary
| Measurement | Belizean Data | Self-Care Disability Data |
| Minimum | 0.018% | 0.38% |
| Maximum | 12.1% | 4.5% |
| Range | 12.0% | 4.1% |
| Mean | 1.6% | 2.7% |
| Median | 1.2% | 2.7% |
| Interquartile 25% (IQ1) | 0.58% | 2.3% |
| Interquartile 75% (IQ3) | 1.9% | 3.3% |
| Interquartile Range (IQR) | 1.3% | 1.0% |
| Standard Deviation (Sample) | 1.9% | 0.92% |
| Standard Deviation (Population) | 1.8% | 0.91% |
Correlation Details
| Belizean Percentile | Sample Size | Self-Care Disability |
[ 0.0% - 0.5% ] 0.018% | 83,034,761 | 2.5% |
[ 0.0% - 0.5% ] 0.073% | 26,231,630 | 2.7% |
[ 0.0% - 0.5% ] 0.11% | 12,868,385 | 2.5% |
[ 0.0% - 0.5% ] 0.16% | 5,913,668 | 2.6% |
[ 0.0% - 0.5% ] 0.21% | 6,778,030 | 2.9% |
[ 0.0% - 0.5% ] 0.25% | 2,320,825 | 2.6% |
[ 0.0% - 0.5% ] 0.31% | 1,272,561 | 2.6% |
[ 0.0% - 0.5% ] 0.35% | 1,561,017 | 2.6% |
[ 0.0% - 0.5% ] 0.40% | 573,726 | 2.4% |
[ 0.0% - 0.5% ] 0.45% | 310,316 | 2.2% |
[ 0.0% - 0.5% ] 0.49% | 603,217 | 3.0% |
[ 0.5% - 1.0% ] 0.54% | 131,088 | 3.1% |
[ 0.5% - 1.0% ] 0.58% | 453,489 | 3.3% |
[ 0.5% - 1.0% ] 0.63% | 111,057 | 2.6% |
[ 0.5% - 1.0% ] 0.68% | 149,048 | 3.3% |
[ 0.5% - 1.0% ] 0.72% | 182,566 | 3.1% |
[ 0.5% - 1.0% ] 0.76% | 98,609 | 3.5% |
[ 0.5% - 1.0% ] 0.83% | 109,667 | 2.7% |
[ 0.5% - 1.0% ] 0.87% | 166,879 | 3.0% |
[ 0.5% - 1.0% ] 0.92% | 89,195 | 2.7% |
[ 0.5% - 1.0% ] 0.97% | 175,979 | 2.3% |
[ 1.0% - 1.5% ] 1.02% | 76,338 | 1.9% |
[ 1.0% - 1.5% ] 1.05% | 44,093 | 1.8% |
[ 1.0% - 1.5% ] 1.09% | 117,867 | 3.2% |
[ 1.0% - 1.5% ] 1.16% | 19,502 | 3.7% |
[ 1.0% - 1.5% ] 1.21% | 18,051 | 3.8% |
[ 1.0% - 1.5% ] 1.25% | 86,673 | 4.1% |
[ 1.0% - 1.5% ] 1.29% | 88,940 | 2.3% |
[ 1.0% - 1.5% ] 1.34% | 64,802 | 2.8% |
[ 1.0% - 1.5% ] 1.37% | 1,966 | 0.38% |
[ 1.0% - 1.5% ] 1.44% | 4,946 | 3.4% |
[ 1.5% - 2.0% ] 1.53% | 115,858 | 3.7% |
[ 1.5% - 2.0% ] 1.57% | 15,476 | 2.5% |
[ 1.5% - 2.0% ] 1.68% | 32,229 | 2.5% |
[ 1.5% - 2.0% ] 1.72% | 50,024 | 4.5% |
[ 1.5% - 2.0% ] 1.75% | 43,092 | 3.4% |
[ 1.5% - 2.0% ] 1.82% | 12,651 | 0.98% |
[ 1.5% - 2.0% ] 1.92% | 49,898 | 4.5% |
[ 2.0% - 2.5% ] 2.04% | 7,702 | 2.2% |
[ 2.0% - 2.5% ] 2.19% | 18,360 | 3.5% |
[ 2.0% - 2.5% ] 2.23% | 22,059 | 1.9% |
[ 2.0% - 2.5% ] 2.42% | 20,336 | 2.4% |
[ 2.0% - 2.5% ] 2.48% | 45,322 | 4.1% |
[ 2.5% - 3.0% ] 2.89% | 1,106 | 3.2% |
[ 3.0% - 3.5% ] 3.00% | 1,932 | 3.3% |
[ 3.0% - 3.5% ] 3.13% | 2,204 | 0.55% |
[ 3.0% - 3.5% ] 3.22% | 1,489 | 2.2% |
[ 4.5% - 5.0% ] 4.60% | 2,739 | 0.68% |
[ 4.5% - 5.0% ] 4.68% | 770 | 2.0% |
[ 12.0% - 12.5% ] 12.07% | 895 | 1.0% |