Belizean Receiving Food Stamps

COMPARE

Belizean
Race
Ancestry
AfghanAfricanAlaska NativeAlaskan AthabascanAlbanianAleutAlsatianAmericanApacheArabArapahoArgentineanArmenianAssyrian/Chaldean/SyriacAustralianAustrianBahamianBangladeshiBarbadianBasqueBelgianBelizeanBermudanBhutaneseBlackfeetBolivianBrazilianBritishBritish West IndianBulgarianBurmeseCajunCambodianCanadianCape VerdeanCarpatho RusynCelticCentral AmericanCentral American IndianCherokeeCheyenneChickasawChileanChineseChippewaChoctawColombianColvilleComancheCosta RicanCreeCreekCroatianCrowCubanCypriotCzechCzechoslovakianDanishDelawareDominicanDutchDutch West IndianEastern EuropeanEcuadorianEgyptianEnglishEstonianEthiopianEuropeanFijianFilipinoFinnishFrenchFrench American IndianFrench CanadianGermanGerman RussianGhanaianGreekGuamanian/ChamorroGuatemalanGuyaneseHaitianHmongHonduranHopiHoumaHungarianIcelanderIndian (Asian)IndonesianInupiatIranianIraqiIrishIroquoisIsraeliItalianJamaicanJapaneseJordanianKenyanKiowaKoreanLaotianLatvianLebaneseLiberianLithuanianLumbeeLuxembourgerMacedonianMalaysianMalteseMarshalleseMenomineeMexicanMexican American IndianMongolianMoroccanNative HawaiianNavajoNepaleseNew ZealanderNicaraguanNigerianNorthern EuropeanNorwegianOkinawanOsageOttawaPaiutePakistaniPalestinianPanamanianParaguayanPennsylvania GermanPeruvianPimaPolishPortuguesePotawatomiPuebloPuerto RicanPuget Sound SalishRomanianRussianSalvadoranSamoanScandinavianScotch-IrishScottishSeminoleSenegaleseSerbianShoshoneSierra LeoneanSiouxSlavicSlovakSloveneSomaliSouth AfricanSouth AmericanSouth American IndianSoviet UnionSpaniardSpanishSpanish AmericanSpanish American IndianSri LankanSubsaharan AfricanSudaneseSwedishSwissSyrianTaiwaneseThaiTlingit-HaidaTohono O'OdhamTonganTrinidadian and TobagonianTsimshianTurkishU.S. Virgin IslanderUgandanUkrainianUruguayanUteVenezuelanVietnameseWelshWest IndianYakamaYaquiYugoslavianYumanYup'ikZimbabwean
Immigration
NonimmigrantsImmigrantsAfghanistanAfricaAlbaniaArgentinaArmeniaAsiaAustraliaAustriaBahamasBangladeshBarbadosBelarusBelgiumBelizeBoliviaBosnia and HerzegovinaBrazilBulgariaBurma/MyanmarCabo VerdeCambodiaCameroonCanadaCaribbeanCentral AmericaChileChinaColombiaCongoCosta RicaCroatiaCubaCzechoslovakiaDenmarkDominicaDominican RepublicEastern AfricaEastern AsiaEastern EuropeEcuadorEgyptEl SalvadorEnglandEritreaEthiopiaEuropeFijiFranceGermanyGhanaGreeceGrenadaGuatemalaGuyanaHaitiHondurasHong KongHungaryIndiaIndonesiaIranIraqIrelandIsraelItalyJamaicaJapanJordanKazakhstanKenyaKoreaKuwaitLaosLatin AmericaLatviaLebanonLiberiaLithuaniaMalaysiaMexicoMicronesiaMiddle AfricaMoldovaMoroccoNepalNetherlandsNicaraguaNigeriaNorth AmericaNorth MacedoniaNorthern AfricaNorthern EuropeNorwayOceaniaPakistanPanamaPeruPhilippinesPolandPortugalRomaniaRussiaSaudi ArabiaScotlandSenegalSerbiaSierra LeoneSingaporeSomaliaSouth AfricaSouth AmericaSouth Central AsiaSouth Eastern AsiaSouthern EuropeSpainSri LankaSt. Vincent and the GrenadinesSudanSwedenSwitzerlandSyriaTaiwanThailandTrinidad and TobagoTurkeyUgandaUkraineUruguayUzbekistanVenezuelaVietnamWest IndiesWestern AfricaWestern AsiaWestern EuropeYemenZaireZimbabweAzores
Select to Compare
Race
Ancestry
AfghanAfricanAlaska NativeAlaskan AthabascanAlbanianAleutAlsatianAmericanApacheArabArapahoArgentineanArmenianAssyrian/Chaldean/SyriacAustralianAustrianBahamianBangladeshiBarbadianBasqueBelgianBermudanBhutaneseBlackfeetBolivianBrazilianBritishBritish West IndianBulgarianBurmeseCajunCambodianCanadianCape VerdeanCarpatho RusynCelticCentral AmericanCentral American IndianCherokeeCheyenneChickasawChileanChineseChippewaChoctawColombianColvilleComancheCosta RicanCreeCreekCroatianCrowCubanCypriotCzechCzechoslovakianDanishDelawareDominicanDutchDutch West IndianEastern EuropeanEcuadorianEgyptianEnglishEstonianEthiopianEuropeanFijianFilipinoFinnishFrenchFrench American IndianFrench CanadianGermanGerman RussianGhanaianGreekGuamanian/ChamorroGuatemalanGuyaneseHaitianHmongHonduranHopiHoumaHungarianIcelanderIndian (Asian)IndonesianInupiatIranianIraqiIrishIroquoisIsraeliItalianJamaicanJapaneseJordanianKenyanKiowaKoreanLaotianLatvianLebaneseLiberianLithuanianLumbeeLuxembourgerMacedonianMalaysianMalteseMarshalleseMenomineeMexicanMexican American IndianMongolianMoroccanNative HawaiianNavajoNepaleseNew ZealanderNicaraguanNigerianNorthern EuropeanNorwegianOkinawanOsageOttawaPaiutePakistaniPalestinianPanamanianParaguayanPennsylvania GermanPeruvianPimaPolishPortuguesePotawatomiPuebloPuerto RicanPuget Sound SalishRomanianRussianSalvadoranSamoanScandinavianScotch-IrishScottishSeminoleSenegaleseSerbianShoshoneSierra LeoneanSiouxSlavicSlovakSloveneSomaliSouth AfricanSouth AmericanSouth American IndianSoviet UnionSpaniardSpanishSpanish AmericanSpanish American IndianSri LankanSubsaharan AfricanSudaneseSwedishSwissSyrianTaiwaneseThaiTlingit-HaidaTohono O'OdhamTonganTrinidadian and TobagonianTsimshianTurkishU.S. Virgin IslanderUgandanUkrainianUruguayanUteVenezuelanVietnameseWelshWest IndianYakamaYaquiYugoslavianYumanYup'ikZimbabwean
Immigration
NonimmigrantsImmigrantsAfghanistanAfricaAlbaniaArgentinaArmeniaAsiaAustraliaAustriaBahamasBangladeshBarbadosBelarusBelgiumBelizeBoliviaBosnia and HerzegovinaBrazilBulgariaBurma/MyanmarCabo VerdeCambodiaCameroonCanadaCaribbeanCentral AmericaChileChinaColombiaCongoCosta RicaCroatiaCubaCzechoslovakiaDenmarkDominicaDominican RepublicEastern AfricaEastern AsiaEastern EuropeEcuadorEgyptEl SalvadorEnglandEritreaEthiopiaEuropeFijiFranceGermanyGhanaGreeceGrenadaGuatemalaGuyanaHaitiHondurasHong KongHungaryIndiaIndonesiaIranIraqIrelandIsraelItalyJamaicaJapanJordanKazakhstanKenyaKoreaKuwaitLaosLatin AmericaLatviaLebanonLiberiaLithuaniaMalaysiaMexicoMicronesiaMiddle AfricaMoldovaMoroccoNepalNetherlandsNicaraguaNigeriaNorth AmericaNorth MacedoniaNorthern AfricaNorthern EuropeNorwayOceaniaPakistanPanamaPeruPhilippinesPolandPortugalRomaniaRussiaSaudi ArabiaScotlandSenegalSerbiaSierra LeoneSingaporeSomaliaSouth AfricaSouth AmericaSouth Central AsiaSouth Eastern AsiaSouthern EuropeSpainSri LankaSt. Vincent and the GrenadinesSudanSwedenSwitzerlandSyriaTaiwanThailandTrinidad and TobagoTurkeyUgandaUkraineUruguayUzbekistanVenezuelaVietnamWest IndiesWestern AfricaWestern AsiaWestern EuropeYemenZaireZimbabweAzores
Receiving Food Stamps
Income
Poverty
Unemployment
Labor Participation
Family Structure
Vehicle Availability
Education Level
Disability

Belizean Receiving Food Stamps
Tragic

14.8%
PUBLIC INCOME | FOOD STAMPS
0.1/ 100
METRIC RATING
278th/ 347
METRIC RANK

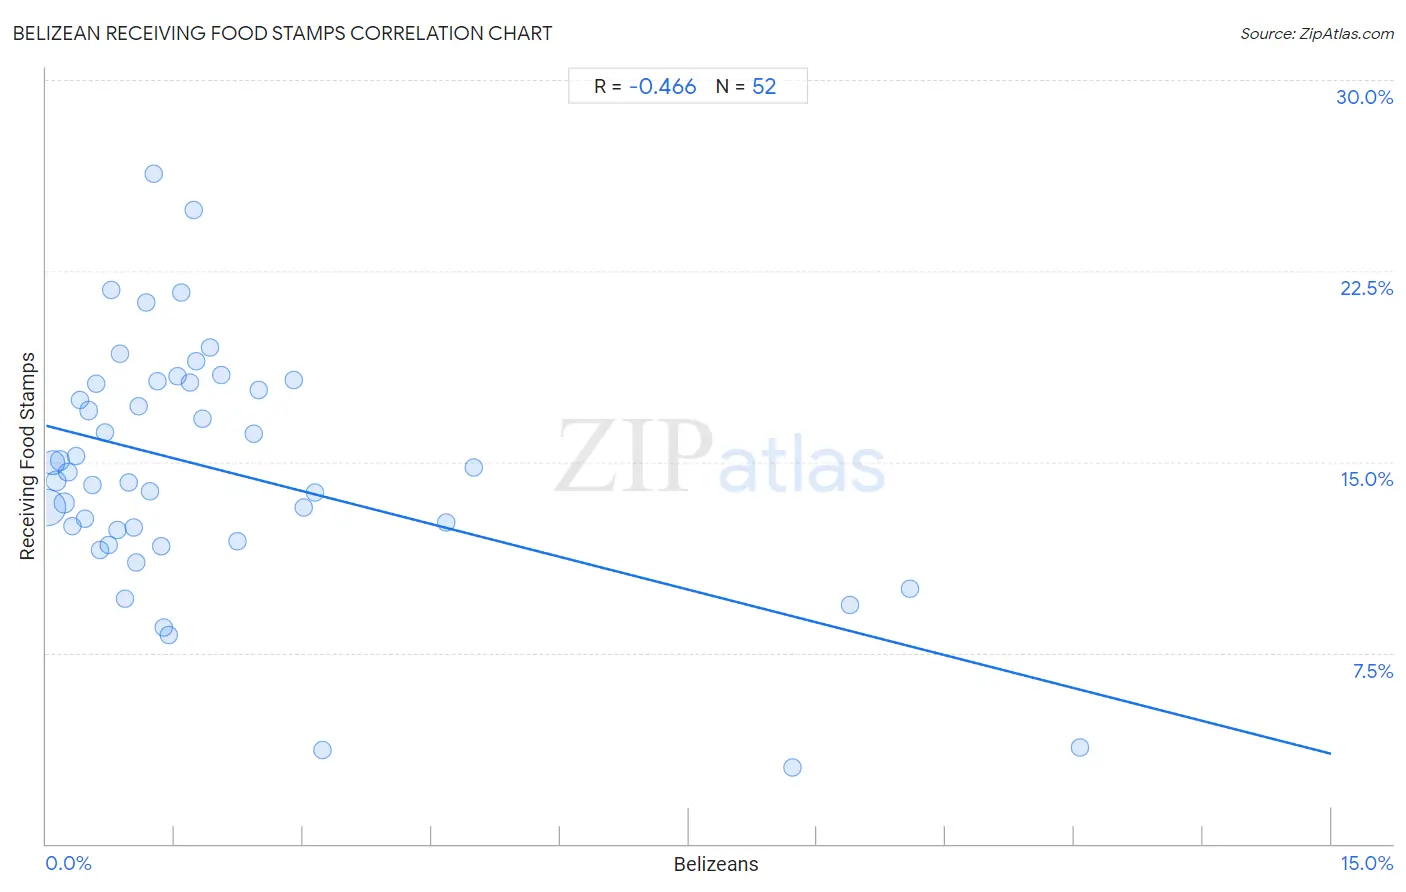
Belizean Receiving Food Stamps Correlation Chart

The statistical analysis conducted on geographies consisting of 144,020,862 people shows a moderate negative correlation between the proportion of Belizeans and percentage of population receiving government assistance and/or food stamps in the United States with a correlation coefficient (R) of -0.466 and weighted average of 14.8%. On average, for every 1% (one percent) increase in Belizeans within a typical geography, there is a decrease of 0.86% in percentage of population receiving government assistance and/or food stamps.
Belizean Receiving Food Stamps
It is essential to understand that the correlation between the percentage of Belizeans and percentage of population receiving government assistance and/or food stamps does not imply a direct cause-and-effect relationship. It remains uncertain whether the presence of Belizeans influences an upward or downward trend in the level of percentage of population receiving government assistance and/or food stamps within an area, or if Belizeans simply ended up residing in those areas with higher or lower levels of percentage of population receiving government assistance and/or food stamps due to other factors.

Demographics Similar to Belizeans by Receiving Food Stamps

In terms of receiving food stamps, the demographic groups most similar to Belizeans are Seminole (14.8%, a difference of 0.13%), Liberian (14.8%, a difference of 0.18%), Kiowa (14.9%, a difference of 0.27%), Ecuadorian (14.9%, a difference of 0.32%), and Spanish American Indian (14.9%, a difference of 0.64%).
DemographicsRating | RankReceiving Food Stamps
Immigrants from Guatemala
0.1
/100
|
#271
Tragic
14.6%
Chippewa
0.1
/100
|
#272
Tragic
14.7%
Alaskan Athabascans
0.1
/100
|
#273
Tragic
14.7%
Immigrants from Western Africa
0.1
/100
|
#274
Tragic
14.7%
Ute
0.1
/100
|
#275
Tragic
14.7%
Liberians
0.1
/100
|
#276
Tragic
14.8%
Seminole
0.1
/100
|
#277
Tragic
14.8%
Belizeans
0.1
/100
|
#278
Tragic
14.8%
Kiowa
0.0
/100
|
#279
Tragic
14.9%
Ecuadorians
0.0
/100
|
#280
Tragic
14.9%
Spanish American Indians
0.0
/100
|
#281
Tragic
14.9%
Immigrants from Central America
0.0
/100
|
#282
Tragic
15.0%
Bangladeshis
0.0
/100
|
#283
Tragic
15.0%
Immigrants from Ecuador
0.0
/100
|
#284
Tragic
15.0%
Immigrants from Liberia
0.0
/100
|
#285
Tragic
15.1%

Belizean Receiving Food Stamps Correlation Summary

MeasurementBelizean DataReceiving Food Stamps Data
Minimum0.018%3.0%
Maximum12.1%26.3%
Range12.0%23.3%
Mean2.0%14.7%
Median1.2%14.4%
Interquartile 25% (IQ1)0.60%12.1%
Interquartile 75% (IQ3)2.1%18.1%
Interquartile Range (IQR)1.5%6.0%
Standard Deviation (Sample)2.6%4.8%
Standard Deviation (Population)2.6%4.7%

Correlation Details

Belizean PercentileSample SizeReceiving Food Stamps
[
0.0%
-
0.5%
]
0.018%
82,983,09213.2%
[
0.0%
-
0.5%
]
0.073%
26,232,07015.0%
[
0.0%
-
0.5%
]
0.11%
12,844,83514.3%
[
0.0%
-
0.5%
]
0.16%
5,916,42515.0%
[
0.0%
-
0.5%
]
0.21%
6,773,26613.4%
[
0.0%
-
0.5%
]
0.25%
2,304,31714.6%
[
0.0%
-
0.5%
]
0.31%
1,270,50212.5%
[
0.0%
-
0.5%
]
0.35%
1,558,05715.2%
[
0.0%
-
0.5%
]
0.40%
573,72617.4%
[
0.0%
-
0.5%
]
0.45%
316,02412.8%
[
0.0%
-
0.5%
]
0.49%
606,91617.0%
[
0.5%
-
1.0%
]
0.54%
138,23014.1%
[
0.5%
-
1.0%
]
0.58%
454,54618.1%
[
0.5%
-
1.0%
]
0.63%
111,05711.5%
[
0.5%
-
1.0%
]
0.69%
166,98216.2%
[
0.5%
-
1.0%
]
0.72%
182,56611.8%
[
0.5%
-
1.0%
]
0.76%
98,60921.8%
[
0.5%
-
1.0%
]
0.83%
109,66712.3%
[
0.5%
-
1.0%
]
0.87%
166,87919.2%
[
0.5%
-
1.0%
]
0.92%
89,1959.6%
[
0.5%
-
1.0%
]
0.97%
175,97914.2%
[
1.0%
-
1.5%
]
1.02%
76,33812.4%
[
1.0%
-
1.5%
]
1.05%
44,09311.0%
[
1.0%
-
1.5%
]
1.09%
117,86717.2%
[
1.0%
-
1.5%
]
1.16%
19,50221.3%
[
1.0%
-
1.5%
]
1.21%
18,05113.9%
[
1.0%
-
1.5%
]
1.25%
86,67326.3%
[
1.0%
-
1.5%
]
1.29%
88,94018.2%
[
1.0%
-
1.5%
]
1.34%
64,80211.7%
[
1.0%
-
1.5%
]
1.37%
1,9668.5%
[
1.0%
-
1.5%
]
1.44%
4,9468.2%
[
1.5%
-
2.0%
]
1.53%
115,85818.4%
[
1.5%
-
2.0%
]
1.57%
15,47621.6%
[
1.5%
-
2.0%
]
1.68%
32,22918.1%
[
1.5%
-
2.0%
]
1.72%
50,02424.9%
[
1.5%
-
2.0%
]
1.75%
43,09218.9%
[
1.5%
-
2.0%
]
1.82%
12,65116.7%
[
1.5%
-
2.0%
]
1.92%
49,89819.5%
[
2.0%
-
2.5%
]
2.04%
7,70218.4%
[
2.0%
-
2.5%
]
2.23%
22,05911.9%
[
2.0%
-
2.5%
]
2.42%
20,33616.1%
[
2.0%
-
2.5%
]
2.48%
45,32217.8%
[
2.5%
-
3.0%
]
2.89%
1,10618.2%
[
3.0%
-
3.5%
]
3.00%
1,93213.2%
[
3.0%
-
3.5%
]
3.13%
2,20413.8%
[
3.0%
-
3.5%
]
3.22%
1,4893.7%
[
4.5%
-
5.0%
]
4.68%
77012.6%
[
4.5%
-
5.0%
]
4.99%
42114.8%
[
8.5%
-
9.0%
]
8.71%
1,0333.0%
[
9.0%
-
9.5%
]
9.38%
1289.4%
[
10.0%
-
10.5%
]
10.08%
11910.0%
[
12.0%
-
12.5%
]
12.07%
8953.8%