Belizean GED/Equivalency

COMPARE

Belizean
Race
Ancestry
AfghanAfricanAlaska NativeAlaskan AthabascanAlbanianAleutAlsatianAmericanApacheArabArapahoArgentineanArmenianAssyrian/Chaldean/SyriacAustralianAustrianBahamianBangladeshiBarbadianBasqueBelgianBelizeanBermudanBhutaneseBlackfeetBolivianBrazilianBritishBritish West IndianBulgarianBurmeseCajunCambodianCanadianCape VerdeanCarpatho RusynCelticCentral AmericanCentral American IndianCherokeeCheyenneChickasawChileanChineseChippewaChoctawColombianColvilleComancheCosta RicanCreeCreekCroatianCrowCubanCypriotCzechCzechoslovakianDanishDelawareDominicanDutchDutch West IndianEastern EuropeanEcuadorianEgyptianEnglishEstonianEthiopianEuropeanFijianFilipinoFinnishFrenchFrench American IndianFrench CanadianGermanGerman RussianGhanaianGreekGuamanian/ChamorroGuatemalanGuyaneseHaitianHmongHonduranHopiHoumaHungarianIcelanderIndian (Asian)IndonesianInupiatIranianIraqiIrishIroquoisIsraeliItalianJamaicanJapaneseJordanianKenyanKiowaKoreanLaotianLatvianLebaneseLiberianLithuanianLumbeeLuxembourgerMacedonianMalaysianMalteseMarshalleseMenomineeMexicanMexican American IndianMongolianMoroccanNative HawaiianNavajoNepaleseNew ZealanderNicaraguanNigerianNorthern EuropeanNorwegianOkinawanOsageOttawaPaiutePakistaniPalestinianPanamanianParaguayanPennsylvania GermanPeruvianPimaPolishPortuguesePotawatomiPuebloPuerto RicanPuget Sound SalishRomanianRussianSalvadoranSamoanScandinavianScotch-IrishScottishSeminoleSenegaleseSerbianShoshoneSierra LeoneanSiouxSlavicSlovakSloveneSomaliSouth AfricanSouth AmericanSouth American IndianSoviet UnionSpaniardSpanishSpanish AmericanSpanish American IndianSri LankanSubsaharan AfricanSudaneseSwedishSwissSyrianTaiwaneseThaiTlingit-HaidaTohono O'OdhamTonganTrinidadian and TobagonianTsimshianTurkishU.S. Virgin IslanderUgandanUkrainianUruguayanUteVenezuelanVietnameseWelshWest IndianYakamaYaquiYugoslavianYumanYup'ikZimbabwean
Immigration
NonimmigrantsImmigrantsAfghanistanAfricaAlbaniaArgentinaArmeniaAsiaAustraliaAustriaBahamasBangladeshBarbadosBelarusBelgiumBelizeBoliviaBosnia and HerzegovinaBrazilBulgariaBurma/MyanmarCabo VerdeCambodiaCameroonCanadaCaribbeanCentral AmericaChileChinaColombiaCongoCosta RicaCroatiaCubaCzechoslovakiaDenmarkDominicaDominican RepublicEastern AfricaEastern AsiaEastern EuropeEcuadorEgyptEl SalvadorEnglandEritreaEthiopiaEuropeFijiFranceGermanyGhanaGreeceGrenadaGuatemalaGuyanaHaitiHondurasHong KongHungaryIndiaIndonesiaIranIraqIrelandIsraelItalyJamaicaJapanJordanKazakhstanKenyaKoreaKuwaitLaosLatin AmericaLatviaLebanonLiberiaLithuaniaMalaysiaMexicoMicronesiaMiddle AfricaMoldovaMoroccoNepalNetherlandsNicaraguaNigeriaNorth AmericaNorth MacedoniaNorthern AfricaNorthern EuropeNorwayOceaniaPakistanPanamaPeruPhilippinesPolandPortugalRomaniaRussiaSaudi ArabiaScotlandSenegalSerbiaSierra LeoneSingaporeSomaliaSouth AfricaSouth AmericaSouth Central AsiaSouth Eastern AsiaSouthern EuropeSpainSri LankaSt. Vincent and the GrenadinesSudanSwedenSwitzerlandSyriaTaiwanThailandTrinidad and TobagoTurkeyUgandaUkraineUruguayUzbekistanVenezuelaVietnamWest IndiesWestern AfricaWestern AsiaWestern EuropeYemenZaireZimbabweAzores
Select to Compare
Race
Ancestry
AfghanAfricanAlaska NativeAlaskan AthabascanAlbanianAleutAlsatianAmericanApacheArabArapahoArgentineanArmenianAssyrian/Chaldean/SyriacAustralianAustrianBahamianBangladeshiBarbadianBasqueBelgianBermudanBhutaneseBlackfeetBolivianBrazilianBritishBritish West IndianBulgarianBurmeseCajunCambodianCanadianCape VerdeanCarpatho RusynCelticCentral AmericanCentral American IndianCherokeeCheyenneChickasawChileanChineseChippewaChoctawColombianColvilleComancheCosta RicanCreeCreekCroatianCrowCubanCypriotCzechCzechoslovakianDanishDelawareDominicanDutchDutch West IndianEastern EuropeanEcuadorianEgyptianEnglishEstonianEthiopianEuropeanFijianFilipinoFinnishFrenchFrench American IndianFrench CanadianGermanGerman RussianGhanaianGreekGuamanian/ChamorroGuatemalanGuyaneseHaitianHmongHonduranHopiHoumaHungarianIcelanderIndian (Asian)IndonesianInupiatIranianIraqiIrishIroquoisIsraeliItalianJamaicanJapaneseJordanianKenyanKiowaKoreanLaotianLatvianLebaneseLiberianLithuanianLumbeeLuxembourgerMacedonianMalaysianMalteseMarshalleseMenomineeMexicanMexican American IndianMongolianMoroccanNative HawaiianNavajoNepaleseNew ZealanderNicaraguanNigerianNorthern EuropeanNorwegianOkinawanOsageOttawaPaiutePakistaniPalestinianPanamanianParaguayanPennsylvania GermanPeruvianPimaPolishPortuguesePotawatomiPuebloPuerto RicanPuget Sound SalishRomanianRussianSalvadoranSamoanScandinavianScotch-IrishScottishSeminoleSenegaleseSerbianShoshoneSierra LeoneanSiouxSlavicSlovakSloveneSomaliSouth AfricanSouth AmericanSouth American IndianSoviet UnionSpaniardSpanishSpanish AmericanSpanish American IndianSri LankanSubsaharan AfricanSudaneseSwedishSwissSyrianTaiwaneseThaiTlingit-HaidaTohono O'OdhamTonganTrinidadian and TobagonianTsimshianTurkishU.S. Virgin IslanderUgandanUkrainianUruguayanUteVenezuelanVietnameseWelshWest IndianYakamaYaquiYugoslavianYumanYup'ikZimbabwean
Immigration
NonimmigrantsImmigrantsAfghanistanAfricaAlbaniaArgentinaArmeniaAsiaAustraliaAustriaBahamasBangladeshBarbadosBelarusBelgiumBelizeBoliviaBosnia and HerzegovinaBrazilBulgariaBurma/MyanmarCabo VerdeCambodiaCameroonCanadaCaribbeanCentral AmericaChileChinaColombiaCongoCosta RicaCroatiaCubaCzechoslovakiaDenmarkDominicaDominican RepublicEastern AfricaEastern AsiaEastern EuropeEcuadorEgyptEl SalvadorEnglandEritreaEthiopiaEuropeFijiFranceGermanyGhanaGreeceGrenadaGuatemalaGuyanaHaitiHondurasHong KongHungaryIndiaIndonesiaIranIraqIrelandIsraelItalyJamaicaJapanJordanKazakhstanKenyaKoreaKuwaitLaosLatin AmericaLatviaLebanonLiberiaLithuaniaMalaysiaMexicoMicronesiaMiddle AfricaMoldovaMoroccoNepalNetherlandsNicaraguaNigeriaNorth AmericaNorth MacedoniaNorthern AfricaNorthern EuropeNorwayOceaniaPakistanPanamaPeruPhilippinesPolandPortugalRomaniaRussiaSaudi ArabiaScotlandSenegalSerbiaSierra LeoneSingaporeSomaliaSouth AfricaSouth AmericaSouth Central AsiaSouth Eastern AsiaSouthern EuropeSpainSri LankaSt. Vincent and the GrenadinesSudanSwedenSwitzerlandSyriaTaiwanThailandTrinidad and TobagoTurkeyUgandaUkraineUruguayUzbekistanVenezuelaVietnamWest IndiesWestern AfricaWestern AsiaWestern EuropeYemenZaireZimbabweAzores
GED/Equivalency
Income
Poverty
Unemployment
Labor Participation
Family Structure
Vehicle Availability
Education Level
Disability

Belizean GED/Equivalency
Tragic

80.9%
GED/EQUIVALENCY
0.0/ 100
METRIC RATING
314th/ 347
METRIC RANK

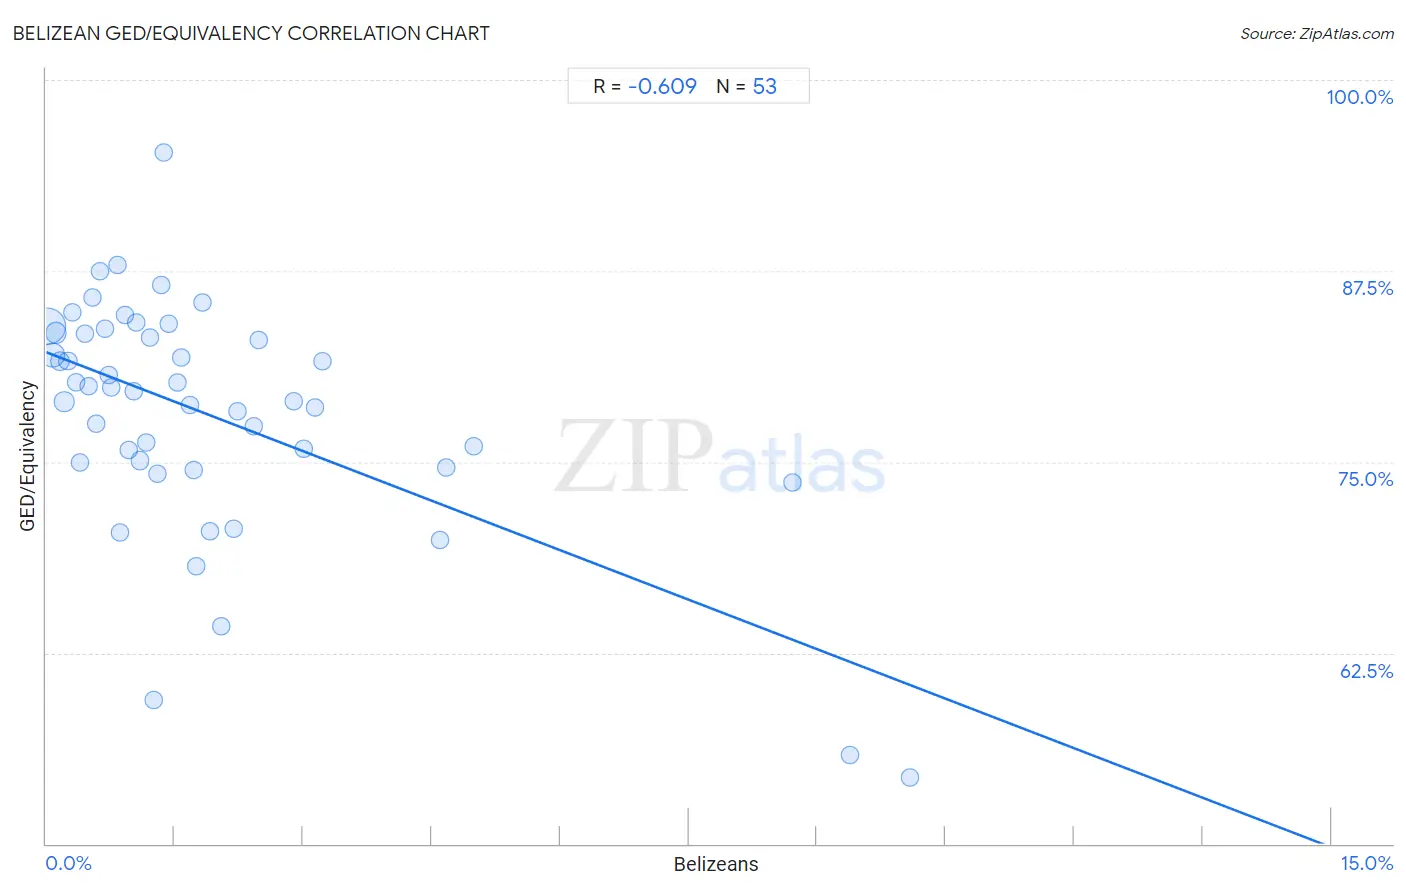
Belizean GED/Equivalency Correlation Chart

The statistical analysis conducted on geographies consisting of 144,224,111 people shows a significant negative correlation between the proportion of Belizeans and percentage of population with at least ged/equivalency education in the United States with a correlation coefficient (R) of -0.609 and weighted average of 80.9%. On average, for every 1% (one percent) increase in Belizeans within a typical geography, there is a decrease of 2.2% in percentage of population with at least ged/equivalency education.
Belizean GED/Equivalency
It is essential to understand that the correlation between the percentage of Belizeans and percentage of population with at least ged/equivalency education does not imply a direct cause-and-effect relationship. It remains uncertain whether the presence of Belizeans influences an upward or downward trend in the level of percentage of population with at least ged/equivalency education within an area, or if Belizeans simply ended up residing in those areas with higher or lower levels of percentage of population with at least ged/equivalency education due to other factors.

Demographics Similar to Belizeans by GED/Equivalency

In terms of ged/equivalency, the demographic groups most similar to Belizeans are Nicaraguan (80.9%, a difference of 0.020%), Cape Verdean (80.9%, a difference of 0.020%), Immigrants from Guyana (81.0%, a difference of 0.060%), Native/Alaskan (80.9%, a difference of 0.060%), and Immigrants from Ecuador (81.0%, a difference of 0.13%).
DemographicsRating | RankGED/Equivalency
Immigrants from Dominica
0.0
/100
|
#307
Tragic
81.1%
Puerto Ricans
0.0
/100
|
#308
Tragic
81.1%
Immigrants from Ecuador
0.0
/100
|
#309
Tragic
81.0%
Immigrants from Guyana
0.0
/100
|
#310
Tragic
81.0%
Natives/Alaskans
0.0
/100
|
#311
Tragic
80.9%
Nicaraguans
0.0
/100
|
#312
Tragic
80.9%
Cape Verdeans
0.0
/100
|
#313
Tragic
80.9%
Belizeans
0.0
/100
|
#314
Tragic
80.9%
Apache
0.0
/100
|
#315
Tragic
80.7%
Central American Indians
0.0
/100
|
#316
Tragic
80.6%
Immigrants from Caribbean
0.0
/100
|
#317
Tragic
80.5%
Yaqui
0.0
/100
|
#318
Tragic
80.5%
Immigrants from Belize
0.0
/100
|
#319
Tragic
80.5%
Immigrants from Cuba
0.0
/100
|
#320
Tragic
80.2%
Yup'ik
0.0
/100
|
#321
Tragic
80.0%

Belizean GED/Equivalency Correlation Summary

MeasurementBelizean DataGED/Equivalency Data
Minimum0.018%54.3%
Maximum10.1%95.3%
Range10.1%40.9%
Mean1.9%78.1%
Median1.3%79.6%
Interquartile 25% (IQ1)0.60%74.8%
Interquartile 75% (IQ3)2.2%83.4%
Interquartile Range (IQR)1.6%8.6%
Standard Deviation (Sample)2.2%7.8%
Standard Deviation (Population)2.2%7.7%

Correlation Details

Belizean PercentileSample SizeGED/Equivalency
[
0.0%
-
0.5%
]
0.018%
83,034,76183.9%
[
0.0%
-
0.5%
]
0.073%
26,265,26582.0%
[
0.0%
-
0.5%
]
0.11%
12,873,41783.4%
[
0.0%
-
0.5%
]
0.16%
5,939,05481.6%
[
0.0%
-
0.5%
]
0.21%
6,782,95978.9%
[
0.0%
-
0.5%
]
0.25%
2,324,82481.6%
[
0.0%
-
0.5%
]
0.31%
1,272,56184.8%
[
0.0%
-
0.5%
]
0.35%
1,563,13080.2%
[
0.0%
-
0.5%
]
0.40%
573,72675.0%
[
0.0%
-
0.5%
]
0.45%
316,02483.4%
[
0.0%
-
0.5%
]
0.49%
608,68179.9%
[
0.5%
-
1.0%
]
0.54%
138,23085.8%
[
0.5%
-
1.0%
]
0.58%
454,54677.5%
[
0.5%
-
1.0%
]
0.63%
111,05787.5%
[
0.5%
-
1.0%
]
0.69%
166,98283.7%
[
0.5%
-
1.0%
]
0.72%
183,64580.7%
[
0.5%
-
1.0%
]
0.76%
98,60979.9%
[
0.5%
-
1.0%
]
0.83%
111,09287.9%
[
0.5%
-
1.0%
]
0.87%
166,87970.4%
[
0.5%
-
1.0%
]
0.92%
89,19584.6%
[
0.5%
-
1.0%
]
0.97%
175,97975.7%
[
1.0%
-
1.5%
]
1.02%
76,33879.6%
[
1.0%
-
1.5%
]
1.05%
44,09384.1%
[
1.0%
-
1.5%
]
1.09%
120,45875.1%
[
1.0%
-
1.5%
]
1.16%
19,50276.3%
[
1.0%
-
1.5%
]
1.21%
18,05183.2%
[
1.0%
-
1.5%
]
1.25%
86,67359.4%
[
1.0%
-
1.5%
]
1.29%
88,94074.2%
[
1.0%
-
1.5%
]
1.34%
67,58086.6%
[
1.0%
-
1.5%
]
1.37%
1,96695.3%
[
1.0%
-
1.5%
]
1.44%
4,94684.1%
[
1.5%
-
2.0%
]
1.53%
115,85880.2%
[
1.5%
-
2.0%
]
1.57%
15,47681.8%
[
1.5%
-
2.0%
]
1.68%
32,22978.7%
[
1.5%
-
2.0%
]
1.72%
50,02474.5%
[
1.5%
-
2.0%
]
1.75%
43,09268.2%
[
1.5%
-
2.0%
]
1.82%
12,65185.4%
[
1.5%
-
2.0%
]
1.92%
49,89870.4%
[
2.0%
-
2.5%
]
2.04%
7,70264.2%
[
2.0%
-
2.5%
]
2.19%
18,36070.6%
[
2.0%
-
2.5%
]
2.23%
22,05978.4%
[
2.0%
-
2.5%
]
2.42%
20,33677.4%
[
2.0%
-
2.5%
]
2.48%
45,32283.0%
[
2.5%
-
3.0%
]
2.89%
1,10678.9%
[
3.0%
-
3.5%
]
3.00%
1,93275.9%
[
3.0%
-
3.5%
]
3.13%
2,20478.6%
[
3.0%
-
3.5%
]
3.22%
1,48981.6%
[
4.5%
-
5.0%
]
4.60%
2,73969.9%
[
4.5%
-
5.0%
]
4.68%
77074.6%
[
4.5%
-
5.0%
]
4.99%
42176.0%
[
8.5%
-
9.0%
]
8.71%
1,03373.7%
[
9.0%
-
9.5%
]
9.38%
12855.8%
[
10.0%
-
10.5%
]
10.08%
11954.3%