Belizean College, Under 1 year
COMPARE
Belizean
Select to Compare
College, Under 1 year
Belizean College, Under 1 year
60.1%
COLLEGE, UNDER 1 YEAR
0.1/ 100
METRIC RATING
282nd/ 347
METRIC RANK
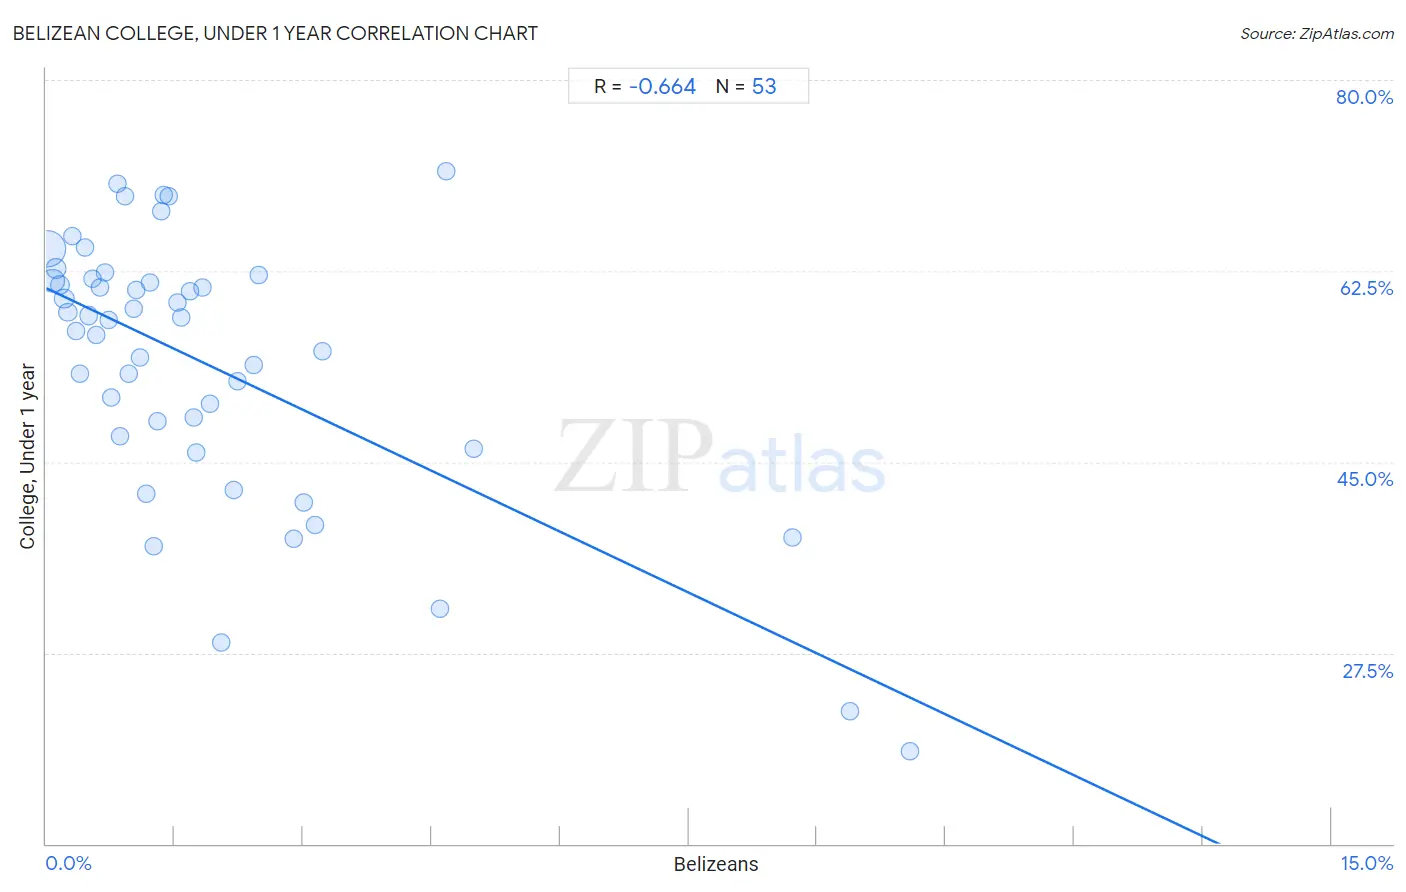
Belizean College, Under 1 year Correlation Chart
The statistical analysis conducted on geographies consisting of 144,224,111 people shows a significant negative correlation between the proportion of Belizeans and percentage of population with at least college, under 1 year education in the United States with a correlation coefficient (R) of -0.664 and weighted average of 60.1%. On average, for every 1% (one percent) increase in Belizeans within a typical geography, there is a decrease of 3.7% in percentage of population with at least college, under 1 year education.
It is essential to understand that the correlation between the percentage of Belizeans and percentage of population with at least college, under 1 year education does not imply a direct cause-and-effect relationship. It remains uncertain whether the presence of Belizeans influences an upward or downward trend in the level of percentage of population with at least college, under 1 year education within an area, or if Belizeans simply ended up residing in those areas with higher or lower levels of percentage of population with at least college, under 1 year education due to other factors.
Demographics Similar to Belizeans by College, Under 1 year
In terms of college, under 1 year, the demographic groups most similar to Belizeans are Cherokee (60.1%, a difference of 0.040%), Crow (60.2%, a difference of 0.16%), Ute (60.2%, a difference of 0.25%), Yaqui (60.2%, a difference of 0.26%), and Bahamian (60.3%, a difference of 0.29%).
| Demographics | Rating | Rank | College, Under 1 year |
| Immigrants from Barbados | 0.1 /100 | #275 | Tragic 60.4% |
| Arapaho | 0.1 /100 | #276 | Tragic 60.3% |
| Bahamians | 0.1 /100 | #277 | Tragic 60.3% |
| Yaqui | 0.1 /100 | #278 | Tragic 60.2% |
| Ute | 0.1 /100 | #279 | Tragic 60.2% |
| Crow | 0.1 /100 | #280 | Tragic 60.2% |
| Cherokee | 0.1 /100 | #281 | Tragic 60.1% |
| Belizeans | 0.1 /100 | #282 | Tragic 60.1% |
| Immigrants from Jamaica | 0.0 /100 | #283 | Tragic 59.7% |
| Immigrants from St. Vincent and the Grenadines | 0.0 /100 | #284 | Tragic 59.6% |
| Paiute | 0.0 /100 | #285 | Tragic 59.6% |
| British West Indians | 0.0 /100 | #286 | Tragic 59.5% |
| Sioux | 0.0 /100 | #287 | Tragic 59.4% |
| Blacks/African Americans | 0.0 /100 | #288 | Tragic 59.4% |
| Choctaw | 0.0 /100 | #289 | Tragic 59.3% |
Belizean College, Under 1 year Correlation Summary
| Measurement | Belizean Data | College, Under 1 year Data |
| Minimum | 0.018% | 18.5% |
| Maximum | 10.1% | 71.6% |
| Range | 10.1% | 53.1% |
| Mean | 1.9% | 53.9% |
| Median | 1.3% | 58.0% |
| Interquartile 25% (IQ1) | 0.60% | 46.8% |
| Interquartile 75% (IQ3) | 2.2% | 61.7% |
| Interquartile Range (IQR) | 1.6% | 14.9% |
| Standard Deviation (Sample) | 2.2% | 12.2% |
| Standard Deviation (Population) | 2.2% | 12.1% |
Correlation Details
| Belizean Percentile | Sample Size | College, Under 1 year |
[ 0.0% - 0.5% ] 0.018% | 83,034,761 | 64.6% |
[ 0.0% - 0.5% ] 0.073% | 26,265,265 | 61.6% |
[ 0.0% - 0.5% ] 0.11% | 12,873,417 | 62.7% |
[ 0.0% - 0.5% ] 0.16% | 5,939,054 | 61.2% |
[ 0.0% - 0.5% ] 0.21% | 6,782,959 | 59.9% |
[ 0.0% - 0.5% ] 0.25% | 2,324,824 | 58.7% |
[ 0.0% - 0.5% ] 0.31% | 1,272,561 | 65.7% |
[ 0.0% - 0.5% ] 0.35% | 1,563,130 | 57.0% |
[ 0.0% - 0.5% ] 0.40% | 573,726 | 53.0% |
[ 0.0% - 0.5% ] 0.45% | 316,024 | 64.7% |
[ 0.0% - 0.5% ] 0.49% | 608,681 | 58.4% |
[ 0.5% - 1.0% ] 0.54% | 138,230 | 61.8% |
[ 0.5% - 1.0% ] 0.58% | 454,546 | 56.7% |
[ 0.5% - 1.0% ] 0.63% | 111,057 | 61.0% |
[ 0.5% - 1.0% ] 0.69% | 166,982 | 62.4% |
[ 0.5% - 1.0% ] 0.72% | 183,645 | 58.0% |
[ 0.5% - 1.0% ] 0.76% | 98,609 | 50.9% |
[ 0.5% - 1.0% ] 0.83% | 111,092 | 70.5% |
[ 0.5% - 1.0% ] 0.87% | 166,879 | 47.4% |
[ 0.5% - 1.0% ] 0.92% | 89,195 | 69.4% |
[ 0.5% - 1.0% ] 0.97% | 175,979 | 53.1% |
[ 1.0% - 1.5% ] 1.02% | 76,338 | 59.1% |
[ 1.0% - 1.5% ] 1.05% | 44,093 | 60.8% |
[ 1.0% - 1.5% ] 1.09% | 120,458 | 54.6% |
[ 1.0% - 1.5% ] 1.16% | 19,502 | 42.1% |
[ 1.0% - 1.5% ] 1.21% | 18,051 | 61.5% |
[ 1.0% - 1.5% ] 1.25% | 86,673 | 37.3% |
[ 1.0% - 1.5% ] 1.29% | 88,940 | 48.7% |
[ 1.0% - 1.5% ] 1.34% | 67,580 | 68.0% |
[ 1.0% - 1.5% ] 1.37% | 1,966 | 69.4% |
[ 1.0% - 1.5% ] 1.44% | 4,946 | 69.4% |
[ 1.5% - 2.0% ] 1.53% | 115,858 | 59.6% |
[ 1.5% - 2.0% ] 1.57% | 15,476 | 58.2% |
[ 1.5% - 2.0% ] 1.68% | 32,229 | 60.6% |
[ 1.5% - 2.0% ] 1.72% | 50,024 | 49.1% |
[ 1.5% - 2.0% ] 1.75% | 43,092 | 45.8% |
[ 1.5% - 2.0% ] 1.82% | 12,651 | 60.9% |
[ 1.5% - 2.0% ] 1.92% | 49,898 | 50.3% |
[ 2.0% - 2.5% ] 2.04% | 7,702 | 28.4% |
[ 2.0% - 2.5% ] 2.19% | 18,360 | 42.4% |
[ 2.0% - 2.5% ] 2.23% | 22,059 | 52.4% |
[ 2.0% - 2.5% ] 2.42% | 20,336 | 53.8% |
[ 2.0% - 2.5% ] 2.48% | 45,322 | 62.1% |
[ 2.5% - 3.0% ] 2.89% | 1,106 | 38.0% |
[ 3.0% - 3.5% ] 3.00% | 1,932 | 41.2% |
[ 3.0% - 3.5% ] 3.13% | 2,204 | 39.2% |
[ 3.0% - 3.5% ] 3.22% | 1,489 | 55.1% |
[ 4.5% - 5.0% ] 4.60% | 2,739 | 31.5% |
[ 4.5% - 5.0% ] 4.68% | 770 | 71.6% |
[ 4.5% - 5.0% ] 4.99% | 421 | 46.2% |
[ 8.5% - 9.0% ] 8.71% | 1,033 | 38.1% |
[ 9.0% - 9.5% ] 9.38% | 128 | 22.1% |
[ 10.0% - 10.5% ] 10.08% | 119 | 18.5% |