Belizean 4 or more Vehicles in Household

COMPARE

Belizean
Race
Ancestry
AfghanAfricanAlaska NativeAlaskan AthabascanAlbanianAleutAlsatianAmericanApacheArabArapahoArgentineanArmenianAssyrian/Chaldean/SyriacAustralianAustrianBahamianBangladeshiBarbadianBasqueBelgianBelizeanBermudanBhutaneseBlackfeetBolivianBrazilianBritishBritish West IndianBulgarianBurmeseCajunCambodianCanadianCape VerdeanCarpatho RusynCelticCentral AmericanCentral American IndianCherokeeCheyenneChickasawChileanChineseChippewaChoctawColombianColvilleComancheCosta RicanCreeCreekCroatianCrowCubanCypriotCzechCzechoslovakianDanishDelawareDominicanDutchDutch West IndianEastern EuropeanEcuadorianEgyptianEnglishEstonianEthiopianEuropeanFijianFilipinoFinnishFrenchFrench American IndianFrench CanadianGermanGerman RussianGhanaianGreekGuamanian/ChamorroGuatemalanGuyaneseHaitianHmongHonduranHopiHoumaHungarianIcelanderIndian (Asian)IndonesianInupiatIranianIraqiIrishIroquoisIsraeliItalianJamaicanJapaneseJordanianKenyanKiowaKoreanLaotianLatvianLebaneseLiberianLithuanianLumbeeLuxembourgerMacedonianMalaysianMalteseMarshalleseMenomineeMexicanMexican American IndianMongolianMoroccanNative HawaiianNavajoNepaleseNew ZealanderNicaraguanNigerianNorthern EuropeanNorwegianOkinawanOsageOttawaPaiutePakistaniPalestinianPanamanianParaguayanPennsylvania GermanPeruvianPimaPolishPortuguesePotawatomiPuebloPuerto RicanPuget Sound SalishRomanianRussianSalvadoranSamoanScandinavianScotch-IrishScottishSeminoleSenegaleseSerbianShoshoneSierra LeoneanSiouxSlavicSlovakSloveneSomaliSouth AfricanSouth AmericanSouth American IndianSoviet UnionSpaniardSpanishSpanish AmericanSpanish American IndianSri LankanSubsaharan AfricanSudaneseSwedishSwissSyrianTaiwaneseThaiTlingit-HaidaTohono O'OdhamTonganTrinidadian and TobagonianTsimshianTurkishU.S. Virgin IslanderUgandanUkrainianUruguayanUteVenezuelanVietnameseWelshWest IndianYakamaYaquiYugoslavianYumanYup'ikZimbabwean
Immigration
NonimmigrantsImmigrantsAfghanistanAfricaAlbaniaArgentinaArmeniaAsiaAustraliaAustriaBahamasBangladeshBarbadosBelarusBelgiumBelizeBoliviaBosnia and HerzegovinaBrazilBulgariaBurma/MyanmarCabo VerdeCambodiaCameroonCanadaCaribbeanCentral AmericaChileChinaColombiaCongoCosta RicaCroatiaCubaCzechoslovakiaDenmarkDominicaDominican RepublicEastern AfricaEastern AsiaEastern EuropeEcuadorEgyptEl SalvadorEnglandEritreaEthiopiaEuropeFijiFranceGermanyGhanaGreeceGrenadaGuatemalaGuyanaHaitiHondurasHong KongHungaryIndiaIndonesiaIranIraqIrelandIsraelItalyJamaicaJapanJordanKazakhstanKenyaKoreaKuwaitLaosLatin AmericaLatviaLebanonLiberiaLithuaniaMalaysiaMexicoMicronesiaMiddle AfricaMoldovaMoroccoNepalNetherlandsNicaraguaNigeriaNorth AmericaNorth MacedoniaNorthern AfricaNorthern EuropeNorwayOceaniaPakistanPanamaPeruPhilippinesPolandPortugalRomaniaRussiaSaudi ArabiaScotlandSenegalSerbiaSierra LeoneSingaporeSomaliaSouth AfricaSouth AmericaSouth Central AsiaSouth Eastern AsiaSouthern EuropeSpainSri LankaSt. Vincent and the GrenadinesSudanSwedenSwitzerlandSyriaTaiwanThailandTrinidad and TobagoTurkeyUgandaUkraineUruguayUzbekistanVenezuelaVietnamWest IndiesWestern AfricaWestern AsiaWestern EuropeYemenZaireZimbabweAzores
Select to Compare
Race
Ancestry
AfghanAfricanAlaska NativeAlaskan AthabascanAlbanianAleutAlsatianAmericanApacheArabArapahoArgentineanArmenianAssyrian/Chaldean/SyriacAustralianAustrianBahamianBangladeshiBarbadianBasqueBelgianBermudanBhutaneseBlackfeetBolivianBrazilianBritishBritish West IndianBulgarianBurmeseCajunCambodianCanadianCape VerdeanCarpatho RusynCelticCentral AmericanCentral American IndianCherokeeCheyenneChickasawChileanChineseChippewaChoctawColombianColvilleComancheCosta RicanCreeCreekCroatianCrowCubanCypriotCzechCzechoslovakianDanishDelawareDominicanDutchDutch West IndianEastern EuropeanEcuadorianEgyptianEnglishEstonianEthiopianEuropeanFijianFilipinoFinnishFrenchFrench American IndianFrench CanadianGermanGerman RussianGhanaianGreekGuamanian/ChamorroGuatemalanGuyaneseHaitianHmongHonduranHopiHoumaHungarianIcelanderIndian (Asian)IndonesianInupiatIranianIraqiIrishIroquoisIsraeliItalianJamaicanJapaneseJordanianKenyanKiowaKoreanLaotianLatvianLebaneseLiberianLithuanianLumbeeLuxembourgerMacedonianMalaysianMalteseMarshalleseMenomineeMexicanMexican American IndianMongolianMoroccanNative HawaiianNavajoNepaleseNew ZealanderNicaraguanNigerianNorthern EuropeanNorwegianOkinawanOsageOttawaPaiutePakistaniPalestinianPanamanianParaguayanPennsylvania GermanPeruvianPimaPolishPortuguesePotawatomiPuebloPuerto RicanPuget Sound SalishRomanianRussianSalvadoranSamoanScandinavianScotch-IrishScottishSeminoleSenegaleseSerbianShoshoneSierra LeoneanSiouxSlavicSlovakSloveneSomaliSouth AfricanSouth AmericanSouth American IndianSoviet UnionSpaniardSpanishSpanish AmericanSpanish American IndianSri LankanSubsaharan AfricanSudaneseSwedishSwissSyrianTaiwaneseThaiTlingit-HaidaTohono O'OdhamTonganTrinidadian and TobagonianTsimshianTurkishU.S. Virgin IslanderUgandanUkrainianUruguayanUteVenezuelanVietnameseWelshWest IndianYakamaYaquiYugoslavianYumanYup'ikZimbabwean
Immigration
NonimmigrantsImmigrantsAfghanistanAfricaAlbaniaArgentinaArmeniaAsiaAustraliaAustriaBahamasBangladeshBarbadosBelarusBelgiumBelizeBoliviaBosnia and HerzegovinaBrazilBulgariaBurma/MyanmarCabo VerdeCambodiaCameroonCanadaCaribbeanCentral AmericaChileChinaColombiaCongoCosta RicaCroatiaCubaCzechoslovakiaDenmarkDominicaDominican RepublicEastern AfricaEastern AsiaEastern EuropeEcuadorEgyptEl SalvadorEnglandEritreaEthiopiaEuropeFijiFranceGermanyGhanaGreeceGrenadaGuatemalaGuyanaHaitiHondurasHong KongHungaryIndiaIndonesiaIranIraqIrelandIsraelItalyJamaicaJapanJordanKazakhstanKenyaKoreaKuwaitLaosLatin AmericaLatviaLebanonLiberiaLithuaniaMalaysiaMexicoMicronesiaMiddle AfricaMoldovaMoroccoNepalNetherlandsNicaraguaNigeriaNorth AmericaNorth MacedoniaNorthern AfricaNorthern EuropeNorwayOceaniaPakistanPanamaPeruPhilippinesPolandPortugalRomaniaRussiaSaudi ArabiaScotlandSenegalSerbiaSierra LeoneSingaporeSomaliaSouth AfricaSouth AmericaSouth Central AsiaSouth Eastern AsiaSouthern EuropeSpainSri LankaSt. Vincent and the GrenadinesSudanSwedenSwitzerlandSyriaTaiwanThailandTrinidad and TobagoTurkeyUgandaUkraineUruguayUzbekistanVenezuelaVietnamWest IndiesWestern AfricaWestern AsiaWestern EuropeYemenZaireZimbabweAzores
4 or more Vehicles in Household
Income
Poverty
Unemployment
Labor Participation
Family Structure
Vehicle Availability
Education Level
Disability

Belizean 4 or more Vehicles in Household
Average

6.3%
4+ VEHICLES AVAILABLE
44.5/ 100
METRIC RATING
178th/ 347
METRIC RANK

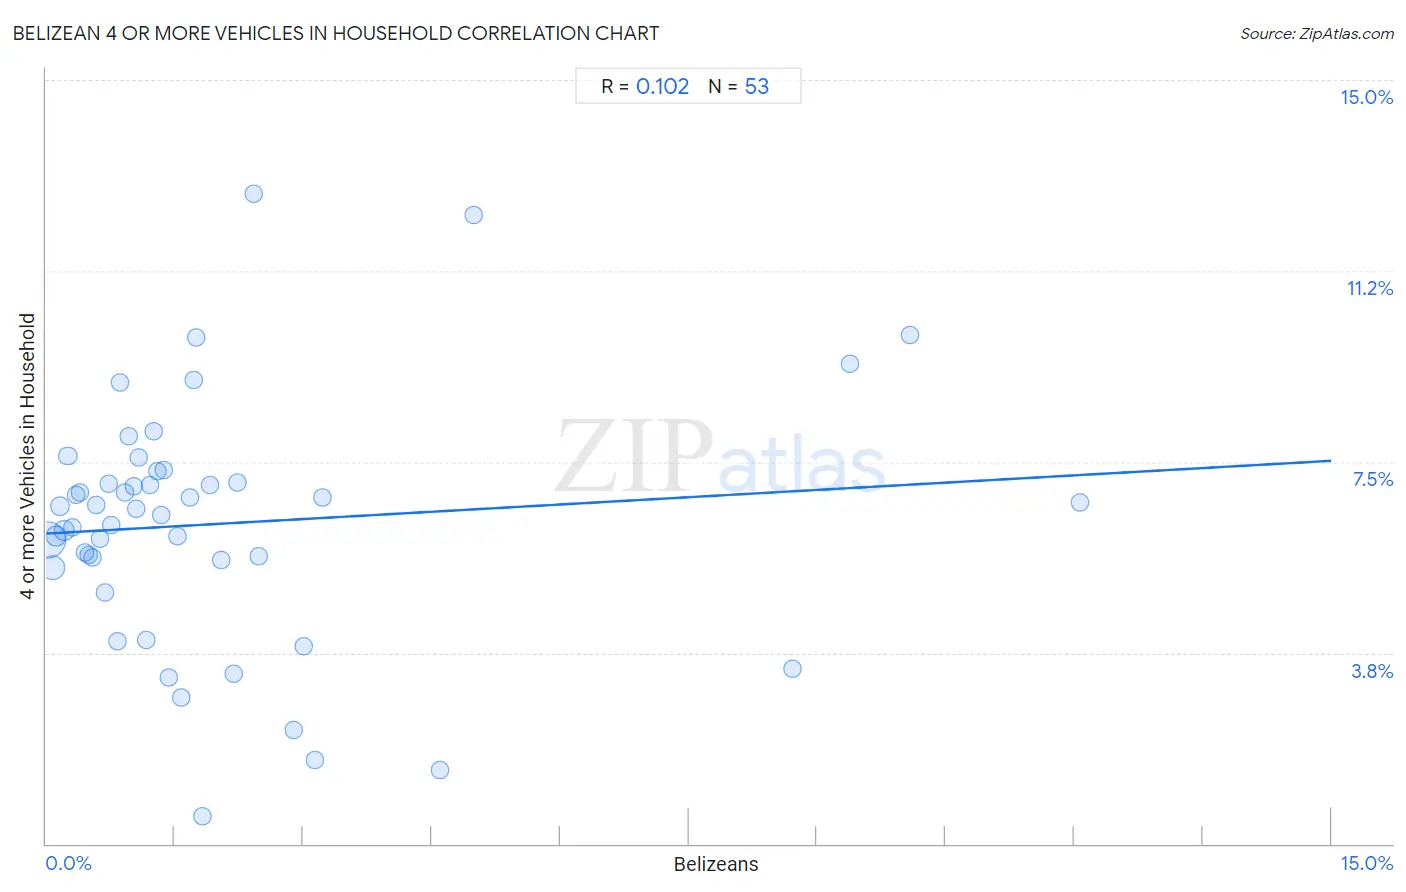
Belizean 4 or more Vehicles in Household Correlation Chart

The statistical analysis conducted on geographies consisting of 143,595,749 people shows a poor positive correlation between the proportion of Belizeans and percentage of households with 4 or more vehicles available in the United States with a correlation coefficient (R) of 0.102 and weighted average of 6.3%. On average, for every 1% (one percent) increase in Belizeans within a typical geography, there is an increase of 0.095% in percentage of households with 4 or more vehicles available.
Belizean 4 or more Vehicles in Household
It is essential to understand that the correlation between the percentage of Belizeans and percentage of households with 4 or more vehicles available does not imply a direct cause-and-effect relationship. It remains uncertain whether the presence of Belizeans influences an upward or downward trend in the level of percentage of households with 4 or more vehicles available within an area, or if Belizeans simply ended up residing in those areas with higher or lower levels of percentage of households with 4 or more vehicles available due to other factors.

Demographics Similar to Belizeans by 4 or more Vehicles in Household

In terms of 4 or more vehicles in household, the demographic groups most similar to Belizeans are Immigrants from Japan (6.3%, a difference of 0.15%), Slovak (6.3%, a difference of 0.24%), Syrian (6.3%, a difference of 0.27%), Ukrainian (6.3%, a difference of 0.31%), and Yugoslavian (6.3%, a difference of 0.35%).
DemographicsRating | Rank4 or more Vehicles in Household
Immigrants from India
51.9
/100
|
#171
Average
6.3%
Immigrants from Lebanon
51.7
/100
|
#172
Average
6.3%
Slovenes
51.1
/100
|
#173
Average
6.3%
Lithuanians
50.0
/100
|
#174
Average
6.3%
Immigrants from Western Europe
48.8
/100
|
#175
Average
6.3%
Ukrainians
47.6
/100
|
#176
Average
6.3%
Slovaks
46.9
/100
|
#177
Average
6.3%
Belizeans
44.5
/100
|
#178
Average
6.3%
Immigrants from Japan
43.1
/100
|
#179
Average
6.3%
Syrians
42.0
/100
|
#180
Average
6.3%
Yugoslavians
41.1
/100
|
#181
Average
6.3%
South American Indians
40.7
/100
|
#182
Average
6.3%
Immigrants from Burma/Myanmar
37.5
/100
|
#183
Fair
6.2%
Iraqis
37.3
/100
|
#184
Fair
6.2%
Thais
36.9
/100
|
#185
Fair
6.2%

Belizean 4 or more Vehicles in Household Correlation Summary

MeasurementBelizean Data4 or more Vehicles in Household Data
Minimum0.018%0.54%
Maximum12.1%12.8%
Range12.0%12.2%
Mean2.0%6.3%
Median1.3%6.6%
Interquartile 25% (IQ1)0.61%5.5%
Interquartile 75% (IQ3)2.2%7.2%
Interquartile Range (IQR)1.6%1.7%
Standard Deviation (Sample)2.6%2.4%
Standard Deviation (Population)2.5%2.4%

Correlation Details

Belizean PercentileSample Size4 or more Vehicles in Household
[
0.0%
-
0.5%
]
0.018%
82,884,3326.0%
[
0.0%
-
0.5%
]
0.073%
26,122,2465.4%
[
0.0%
-
0.5%
]
0.11%
12,748,0116.0%
[
0.0%
-
0.5%
]
0.16%
5,881,7996.6%
[
0.0%
-
0.5%
]
0.21%
6,745,4296.2%
[
0.0%
-
0.5%
]
0.25%
2,292,6887.6%
[
0.0%
-
0.5%
]
0.31%
1,272,5616.2%
[
0.0%
-
0.5%
]
0.35%
1,560,1706.9%
[
0.0%
-
0.5%
]
0.40%
573,7266.9%
[
0.0%
-
0.5%
]
0.45%
310,7025.7%
[
0.0%
-
0.5%
]
0.49%
603,2175.7%
[
0.5%
-
1.0%
]
0.54%
138,2305.6%
[
0.5%
-
1.0%
]
0.59%
400,1776.7%
[
0.5%
-
1.0%
]
0.63%
111,0576.0%
[
0.5%
-
1.0%
]
0.69%
166,9824.9%
[
0.5%
-
1.0%
]
0.72%
182,5667.1%
[
0.5%
-
1.0%
]
0.76%
98,6096.3%
[
0.5%
-
1.0%
]
0.83%
109,6674.0%
[
0.5%
-
1.0%
]
0.87%
166,8799.1%
[
0.5%
-
1.0%
]
0.92%
89,1956.9%
[
0.5%
-
1.0%
]
0.97%
175,9798.0%
[
1.0%
-
1.5%
]
1.02%
76,3387.0%
[
1.0%
-
1.5%
]
1.05%
44,0936.6%
[
1.0%
-
1.5%
]
1.09%
117,8677.6%
[
1.0%
-
1.5%
]
1.16%
19,5024.0%
[
1.0%
-
1.5%
]
1.21%
18,0517.0%
[
1.0%
-
1.5%
]
1.25%
86,6738.1%
[
1.0%
-
1.5%
]
1.29%
88,9407.3%
[
1.0%
-
1.5%
]
1.34%
65,5586.5%
[
1.0%
-
1.5%
]
1.37%
1,9667.3%
[
1.0%
-
1.5%
]
1.44%
4,9463.3%
[
1.5%
-
2.0%
]
1.53%
115,8586.0%
[
1.5%
-
2.0%
]
1.58%
7,9962.9%
[
1.5%
-
2.0%
]
1.68%
32,2296.8%
[
1.5%
-
2.0%
]
1.72%
50,0249.1%
[
1.5%
-
2.0%
]
1.75%
43,0929.9%
[
1.5%
-
2.0%
]
1.82%
12,6510.54%
[
1.5%
-
2.0%
]
1.92%
49,8987.1%
[
2.0%
-
2.5%
]
2.04%
7,7025.6%
[
2.0%
-
2.5%
]
2.19%
18,3603.3%
[
2.0%
-
2.5%
]
2.23%
22,0597.1%
[
2.0%
-
2.5%
]
2.42%
20,33612.8%
[
2.0%
-
2.5%
]
2.48%
45,3225.7%
[
2.5%
-
3.0%
]
2.89%
1,1062.2%
[
3.0%
-
3.5%
]
3.00%
1,9323.9%
[
3.0%
-
3.5%
]
3.13%
2,2041.6%
[
3.0%
-
3.5%
]
3.22%
1,4896.8%
[
4.5%
-
5.0%
]
4.60%
2,7391.4%
[
4.5%
-
5.0%
]
4.99%
42112.3%
[
8.5%
-
9.0%
]
8.71%
1,0333.4%
[
9.0%
-
9.5%
]
9.38%
1289.4%
[
10.0%
-
10.5%
]
10.08%
11910.0%
[
12.0%
-
12.5%
]
12.07%
8956.7%