Belizean 1 or more Vehicles in Household

COMPARE

Belizean
Race
Ancestry
AfghanAfricanAlaska NativeAlaskan AthabascanAlbanianAleutAlsatianAmericanApacheArabArapahoArgentineanArmenianAssyrian/Chaldean/SyriacAustralianAustrianBahamianBangladeshiBarbadianBasqueBelgianBelizeanBermudanBhutaneseBlackfeetBolivianBrazilianBritishBritish West IndianBulgarianBurmeseCajunCambodianCanadianCape VerdeanCarpatho RusynCelticCentral AmericanCentral American IndianCherokeeCheyenneChickasawChileanChineseChippewaChoctawColombianColvilleComancheCosta RicanCreeCreekCroatianCrowCubanCypriotCzechCzechoslovakianDanishDelawareDominicanDutchDutch West IndianEastern EuropeanEcuadorianEgyptianEnglishEstonianEthiopianEuropeanFijianFilipinoFinnishFrenchFrench American IndianFrench CanadianGermanGerman RussianGhanaianGreekGuamanian/ChamorroGuatemalanGuyaneseHaitianHmongHonduranHopiHoumaHungarianIcelanderIndian (Asian)IndonesianInupiatIranianIraqiIrishIroquoisIsraeliItalianJamaicanJapaneseJordanianKenyanKiowaKoreanLaotianLatvianLebaneseLiberianLithuanianLumbeeLuxembourgerMacedonianMalaysianMalteseMarshalleseMenomineeMexicanMexican American IndianMongolianMoroccanNative HawaiianNavajoNepaleseNew ZealanderNicaraguanNigerianNorthern EuropeanNorwegianOkinawanOsageOttawaPaiutePakistaniPalestinianPanamanianParaguayanPennsylvania GermanPeruvianPimaPolishPortuguesePotawatomiPuebloPuerto RicanPuget Sound SalishRomanianRussianSalvadoranSamoanScandinavianScotch-IrishScottishSeminoleSenegaleseSerbianShoshoneSierra LeoneanSiouxSlavicSlovakSloveneSomaliSouth AfricanSouth AmericanSouth American IndianSoviet UnionSpaniardSpanishSpanish AmericanSpanish American IndianSri LankanSubsaharan AfricanSudaneseSwedishSwissSyrianTaiwaneseThaiTlingit-HaidaTohono O'OdhamTonganTrinidadian and TobagonianTsimshianTurkishU.S. Virgin IslanderUgandanUkrainianUruguayanUteVenezuelanVietnameseWelshWest IndianYakamaYaquiYugoslavianYumanYup'ikZimbabwean
Immigration
NonimmigrantsImmigrantsAfghanistanAfricaAlbaniaArgentinaArmeniaAsiaAustraliaAustriaBahamasBangladeshBarbadosBelarusBelgiumBelizeBoliviaBosnia and HerzegovinaBrazilBulgariaBurma/MyanmarCabo VerdeCambodiaCameroonCanadaCaribbeanCentral AmericaChileChinaColombiaCongoCosta RicaCroatiaCubaCzechoslovakiaDenmarkDominicaDominican RepublicEastern AfricaEastern AsiaEastern EuropeEcuadorEgyptEl SalvadorEnglandEritreaEthiopiaEuropeFijiFranceGermanyGhanaGreeceGrenadaGuatemalaGuyanaHaitiHondurasHong KongHungaryIndiaIndonesiaIranIraqIrelandIsraelItalyJamaicaJapanJordanKazakhstanKenyaKoreaKuwaitLaosLatin AmericaLatviaLebanonLiberiaLithuaniaMalaysiaMexicoMicronesiaMiddle AfricaMoldovaMoroccoNepalNetherlandsNicaraguaNigeriaNorth AmericaNorth MacedoniaNorthern AfricaNorthern EuropeNorwayOceaniaPakistanPanamaPeruPhilippinesPolandPortugalRomaniaRussiaSaudi ArabiaScotlandSenegalSerbiaSierra LeoneSingaporeSomaliaSouth AfricaSouth AmericaSouth Central AsiaSouth Eastern AsiaSouthern EuropeSpainSri LankaSt. Vincent and the GrenadinesSudanSwedenSwitzerlandSyriaTaiwanThailandTrinidad and TobagoTurkeyUgandaUkraineUruguayUzbekistanVenezuelaVietnamWest IndiesWestern AfricaWestern AsiaWestern EuropeYemenZaireZimbabweAzores
Select to Compare
Race
Ancestry
AfghanAfricanAlaska NativeAlaskan AthabascanAlbanianAleutAlsatianAmericanApacheArabArapahoArgentineanArmenianAssyrian/Chaldean/SyriacAustralianAustrianBahamianBangladeshiBarbadianBasqueBelgianBermudanBhutaneseBlackfeetBolivianBrazilianBritishBritish West IndianBulgarianBurmeseCajunCambodianCanadianCape VerdeanCarpatho RusynCelticCentral AmericanCentral American IndianCherokeeCheyenneChickasawChileanChineseChippewaChoctawColombianColvilleComancheCosta RicanCreeCreekCroatianCrowCubanCypriotCzechCzechoslovakianDanishDelawareDominicanDutchDutch West IndianEastern EuropeanEcuadorianEgyptianEnglishEstonianEthiopianEuropeanFijianFilipinoFinnishFrenchFrench American IndianFrench CanadianGermanGerman RussianGhanaianGreekGuamanian/ChamorroGuatemalanGuyaneseHaitianHmongHonduranHopiHoumaHungarianIcelanderIndian (Asian)IndonesianInupiatIranianIraqiIrishIroquoisIsraeliItalianJamaicanJapaneseJordanianKenyanKiowaKoreanLaotianLatvianLebaneseLiberianLithuanianLumbeeLuxembourgerMacedonianMalaysianMalteseMarshalleseMenomineeMexicanMexican American IndianMongolianMoroccanNative HawaiianNavajoNepaleseNew ZealanderNicaraguanNigerianNorthern EuropeanNorwegianOkinawanOsageOttawaPaiutePakistaniPalestinianPanamanianParaguayanPennsylvania GermanPeruvianPimaPolishPortuguesePotawatomiPuebloPuerto RicanPuget Sound SalishRomanianRussianSalvadoranSamoanScandinavianScotch-IrishScottishSeminoleSenegaleseSerbianShoshoneSierra LeoneanSiouxSlavicSlovakSloveneSomaliSouth AfricanSouth AmericanSouth American IndianSoviet UnionSpaniardSpanishSpanish AmericanSpanish American IndianSri LankanSubsaharan AfricanSudaneseSwedishSwissSyrianTaiwaneseThaiTlingit-HaidaTohono O'OdhamTonganTrinidadian and TobagonianTsimshianTurkishU.S. Virgin IslanderUgandanUkrainianUruguayanUteVenezuelanVietnameseWelshWest IndianYakamaYaquiYugoslavianYumanYup'ikZimbabwean
Immigration
NonimmigrantsImmigrantsAfghanistanAfricaAlbaniaArgentinaArmeniaAsiaAustraliaAustriaBahamasBangladeshBarbadosBelarusBelgiumBelizeBoliviaBosnia and HerzegovinaBrazilBulgariaBurma/MyanmarCabo VerdeCambodiaCameroonCanadaCaribbeanCentral AmericaChileChinaColombiaCongoCosta RicaCroatiaCubaCzechoslovakiaDenmarkDominicaDominican RepublicEastern AfricaEastern AsiaEastern EuropeEcuadorEgyptEl SalvadorEnglandEritreaEthiopiaEuropeFijiFranceGermanyGhanaGreeceGrenadaGuatemalaGuyanaHaitiHondurasHong KongHungaryIndiaIndonesiaIranIraqIrelandIsraelItalyJamaicaJapanJordanKazakhstanKenyaKoreaKuwaitLaosLatin AmericaLatviaLebanonLiberiaLithuaniaMalaysiaMexicoMicronesiaMiddle AfricaMoldovaMoroccoNepalNetherlandsNicaraguaNigeriaNorth AmericaNorth MacedoniaNorthern AfricaNorthern EuropeNorwayOceaniaPakistanPanamaPeruPhilippinesPolandPortugalRomaniaRussiaSaudi ArabiaScotlandSenegalSerbiaSierra LeoneSingaporeSomaliaSouth AfricaSouth AmericaSouth Central AsiaSouth Eastern AsiaSouthern EuropeSpainSri LankaSt. Vincent and the GrenadinesSudanSwedenSwitzerlandSyriaTaiwanThailandTrinidad and TobagoTurkeyUgandaUkraineUruguayUzbekistanVenezuelaVietnamWest IndiesWestern AfricaWestern AsiaWestern EuropeYemenZaireZimbabweAzores
1 or more Vehicles in Household
Income
Poverty
Unemployment
Labor Participation
Family Structure
Vehicle Availability
Education Level
Disability

Belizean 1 or more Vehicles in Household
Tragic

85.7%
1+ VEHICLES AVAILABLE
0.0/ 100
METRIC RATING
298th/ 347
METRIC RANK

Belizean 1 or more Vehicles in Household Correlation Chart

The statistical analysis conducted on geographies consisting of 144,165,172 people shows a weak positive correlation between the proportion of Belizeans and percentage of households with 1 or more vehicles available in the United States with a correlation coefficient (R) of 0.289 and weighted average of 85.7%. On average, for every 1% (one percent) increase in Belizeans within a typical geography, there is an increase of 0.69% in percentage of households with 1 or more vehicles available.
Belizean 1 or more Vehicles in Household
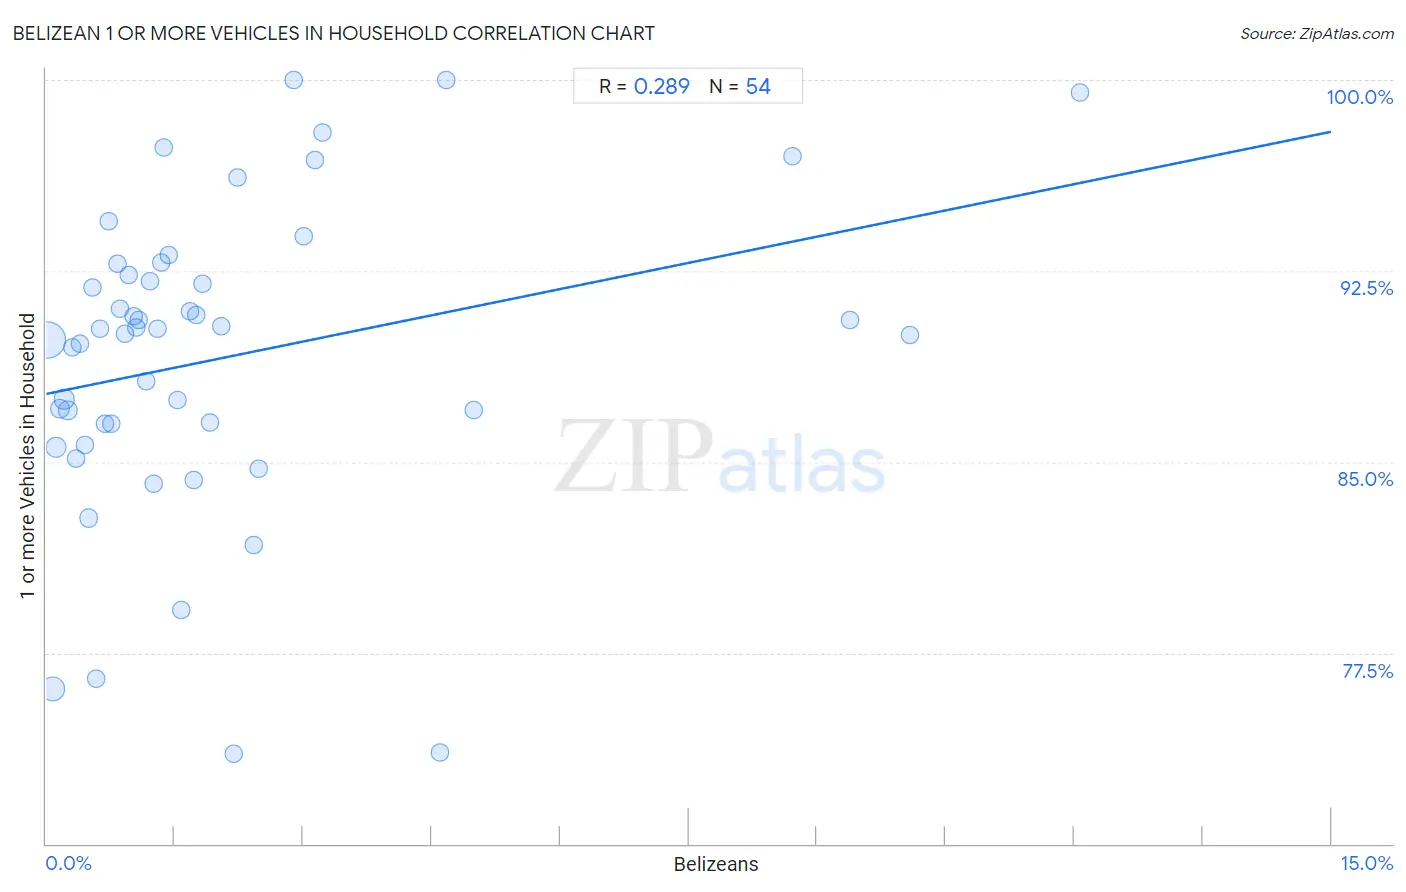
It is essential to understand that the correlation between the percentage of Belizeans and percentage of households with 1 or more vehicles available does not imply a direct cause-and-effect relationship. It remains uncertain whether the presence of Belizeans influences an upward or downward trend in the level of percentage of households with 1 or more vehicles available within an area, or if Belizeans simply ended up residing in those areas with higher or lower levels of percentage of households with 1 or more vehicles available due to other factors.

Demographics Similar to Belizeans by 1 or more Vehicles in Household

In terms of 1 or more vehicles in household, the demographic groups most similar to Belizeans are Paraguayan (85.7%, a difference of 0.080%), Immigrants from Spain (85.8%, a difference of 0.17%), Immigrants from Jamaica (85.8%, a difference of 0.20%), Yuman (85.5%, a difference of 0.24%), and Immigrants from Russia (85.4%, a difference of 0.25%).
DemographicsRating | Rank1 or more Vehicles in Household
Pima
0.0
/100
|
#291
Tragic
86.3%
Okinawans
0.0
/100
|
#292
Tragic
86.1%
Indians (Asian)
0.0
/100
|
#293
Tragic
86.0%
Alaskan Athabascans
0.0
/100
|
#294
Tragic
86.0%
Immigrants from Jamaica
0.0
/100
|
#295
Tragic
85.8%
Immigrants from Spain
0.0
/100
|
#296
Tragic
85.8%
Paraguayans
0.0
/100
|
#297
Tragic
85.7%
Belizeans
0.0
/100
|
#298
Tragic
85.7%
Yuman
0.0
/100
|
#299
Tragic
85.5%
Immigrants from Russia
0.0
/100
|
#300
Tragic
85.4%
Immigrants from Panama
0.0
/100
|
#301
Tragic
85.4%
Moroccans
0.0
/100
|
#302
Tragic
85.4%
Immigrants from Greece
0.0
/100
|
#303
Tragic
85.4%
Immigrants from Ukraine
0.0
/100
|
#304
Tragic
85.2%
Immigrants from China
0.0
/100
|
#305
Tragic
84.9%

Belizean 1 or more Vehicles in Household Correlation Summary

MeasurementBelizean Data1 or more Vehicles in Household Data
Minimum0.018%73.5%
Maximum12.1%100.0%
Range12.0%26.5%
Mean2.1%89.1%
Median1.3%90.1%
Interquartile 25% (IQ1)0.63%86.5%
Interquartile 75% (IQ3)2.2%92.4%
Interquartile Range (IQR)1.6%5.9%
Standard Deviation (Sample)2.6%6.1%
Standard Deviation (Population)2.5%6.0%

Correlation Details

Belizean PercentileSample Size1 or more Vehicles in Household
[
0.0%
-
0.5%
]
0.018%
83,034,76189.8%
[
0.0%
-
0.5%
]
0.073%
26,239,81576.1%
[
0.0%
-
0.5%
]
0.11%
12,854,82185.6%
[
0.0%
-
0.5%
]
0.16%
5,939,05487.1%
[
0.0%
-
0.5%
]
0.21%
6,778,03087.5%
[
0.0%
-
0.5%
]
0.25%
2,320,82587.0%
[
0.0%
-
0.5%
]
0.31%
1,272,56189.5%
[
0.0%
-
0.5%
]
0.35%
1,563,13085.1%
[
0.0%
-
0.5%
]
0.40%
573,72689.7%
[
0.0%
-
0.5%
]
0.45%
316,02485.7%
[
0.0%
-
0.5%
]
0.49%
606,91682.8%
[
0.5%
-
1.0%
]
0.54%
138,23091.9%
[
0.5%
-
1.0%
]
0.58%
454,54676.5%
[
0.5%
-
1.0%
]
0.63%
111,05790.2%
[
0.5%
-
1.0%
]
0.69%
166,98286.5%
[
0.5%
-
1.0%
]
0.72%
182,56694.5%
[
0.5%
-
1.0%
]
0.76%
98,60986.5%
[
0.5%
-
1.0%
]
0.83%
109,66792.8%
[
0.5%
-
1.0%
]
0.87%
166,87991.0%
[
0.5%
-
1.0%
]
0.92%
89,19590.0%
[
0.5%
-
1.0%
]
0.97%
175,97992.4%
[
1.0%
-
1.5%
]
1.02%
76,33890.7%
[
1.0%
-
1.5%
]
1.05%
44,09390.3%
[
1.0%
-
1.5%
]
1.09%
117,86790.6%
[
1.0%
-
1.5%
]
1.16%
19,50288.2%
[
1.0%
-
1.5%
]
1.21%
18,05192.1%
[
1.0%
-
1.5%
]
1.25%
86,67384.1%
[
1.0%
-
1.5%
]
1.29%
88,94090.2%
[
1.0%
-
1.5%
]
1.34%
67,58092.9%
[
1.0%
-
1.5%
]
1.37%
1,96697.4%
[
1.0%
-
1.5%
]
1.44%
4,94693.1%
[
1.5%
-
2.0%
]
1.53%
115,85887.4%
[
1.5%
-
2.0%
]
1.57%
15,47679.2%
[
1.5%
-
2.0%
]
1.68%
32,22990.9%
[
1.5%
-
2.0%
]
1.72%
50,02484.3%
[
1.5%
-
2.0%
]
1.75%
43,09290.8%
[
1.5%
-
2.0%
]
1.82%
12,65192.0%
[
1.5%
-
2.0%
]
1.92%
49,89886.5%
[
2.0%
-
2.5%
]
2.04%
7,70290.3%
[
2.0%
-
2.5%
]
2.19%
18,36073.5%
[
2.0%
-
2.5%
]
2.23%
22,05996.2%
[
2.0%
-
2.5%
]
2.42%
20,33681.7%
[
2.0%
-
2.5%
]
2.48%
45,32284.7%
[
2.5%
-
3.0%
]
2.89%
1,106100.0%
[
3.0%
-
3.5%
]
3.00%
1,93293.9%
[
3.0%
-
3.5%
]
3.13%
2,20496.8%
[
3.0%
-
3.5%
]
3.22%
1,48997.9%
[
4.5%
-
5.0%
]
4.60%
2,73973.6%
[
4.5%
-
5.0%
]
4.68%
770100.0%
[
4.5%
-
5.0%
]
4.99%
42187.0%
[
8.5%
-
9.0%
]
8.71%
1,03397.0%
[
9.0%
-
9.5%
]
9.38%
12890.6%
[
10.0%
-
10.5%
]
10.08%
11990.0%
[
12.0%
-
12.5%
]
12.07%
89599.5%