Belizean Married-Couple Family Poverty

COMPARE

Belizean
Race
Ancestry
AfghanAfricanAlaska NativeAlaskan AthabascanAlbanianAleutAlsatianAmericanApacheArabArapahoArgentineanArmenianAssyrian/Chaldean/SyriacAustralianAustrianBahamianBangladeshiBarbadianBasqueBelgianBelizeanBermudanBhutaneseBlackfeetBolivianBrazilianBritishBritish West IndianBulgarianBurmeseCajunCambodianCanadianCape VerdeanCarpatho RusynCelticCentral AmericanCentral American IndianCherokeeCheyenneChickasawChileanChineseChippewaChoctawColombianColvilleComancheCosta RicanCreeCreekCroatianCrowCubanCypriotCzechCzechoslovakianDanishDelawareDominicanDutchDutch West IndianEastern EuropeanEcuadorianEgyptianEnglishEstonianEthiopianEuropeanFijianFilipinoFinnishFrenchFrench American IndianFrench CanadianGermanGerman RussianGhanaianGreekGuamanian/ChamorroGuatemalanGuyaneseHaitianHmongHonduranHopiHoumaHungarianIcelanderIndian (Asian)IndonesianInupiatIranianIraqiIrishIroquoisIsraeliItalianJamaicanJapaneseJordanianKenyanKiowaKoreanLaotianLatvianLebaneseLiberianLithuanianLumbeeLuxembourgerMacedonianMalaysianMalteseMarshalleseMenomineeMexicanMexican American IndianMongolianMoroccanNative HawaiianNavajoNepaleseNew ZealanderNicaraguanNigerianNorthern EuropeanNorwegianOkinawanOsageOttawaPaiutePakistaniPalestinianPanamanianParaguayanPennsylvania GermanPeruvianPimaPolishPortuguesePotawatomiPuebloPuerto RicanPuget Sound SalishRomanianRussianSalvadoranSamoanScandinavianScotch-IrishScottishSeminoleSenegaleseSerbianShoshoneSierra LeoneanSiouxSlavicSlovakSloveneSomaliSouth AfricanSouth AmericanSouth American IndianSoviet UnionSpaniardSpanishSpanish AmericanSpanish American IndianSri LankanSubsaharan AfricanSudaneseSwedishSwissSyrianTaiwaneseThaiTlingit-HaidaTohono O'OdhamTonganTrinidadian and TobagonianTsimshianTurkishU.S. Virgin IslanderUgandanUkrainianUruguayanUteVenezuelanVietnameseWelshWest IndianYakamaYaquiYugoslavianYumanYup'ikZimbabwean
Immigration
NonimmigrantsImmigrantsAfghanistanAfricaAlbaniaArgentinaArmeniaAsiaAustraliaAustriaBahamasBangladeshBarbadosBelarusBelgiumBelizeBoliviaBosnia and HerzegovinaBrazilBulgariaBurma/MyanmarCabo VerdeCambodiaCameroonCanadaCaribbeanCentral AmericaChileChinaColombiaCongoCosta RicaCroatiaCubaCzechoslovakiaDenmarkDominicaDominican RepublicEastern AfricaEastern AsiaEastern EuropeEcuadorEgyptEl SalvadorEnglandEritreaEthiopiaEuropeFijiFranceGermanyGhanaGreeceGrenadaGuatemalaGuyanaHaitiHondurasHong KongHungaryIndiaIndonesiaIranIraqIrelandIsraelItalyJamaicaJapanJordanKazakhstanKenyaKoreaKuwaitLaosLatin AmericaLatviaLebanonLiberiaLithuaniaMalaysiaMexicoMicronesiaMiddle AfricaMoldovaMoroccoNepalNetherlandsNicaraguaNigeriaNorth AmericaNorth MacedoniaNorthern AfricaNorthern EuropeNorwayOceaniaPakistanPanamaPeruPhilippinesPolandPortugalRomaniaRussiaSaudi ArabiaScotlandSenegalSerbiaSierra LeoneSingaporeSomaliaSouth AfricaSouth AmericaSouth Central AsiaSouth Eastern AsiaSouthern EuropeSpainSri LankaSt. Vincent and the GrenadinesSudanSwedenSwitzerlandSyriaTaiwanThailandTrinidad and TobagoTurkeyUgandaUkraineUruguayUzbekistanVenezuelaVietnamWest IndiesWestern AfricaWestern AsiaWestern EuropeYemenZaireZimbabweAzores
Select to Compare
Race
Ancestry
AfghanAfricanAlaska NativeAlaskan AthabascanAlbanianAleutAlsatianAmericanApacheArabArapahoArgentineanArmenianAssyrian/Chaldean/SyriacAustralianAustrianBahamianBangladeshiBarbadianBasqueBelgianBermudanBhutaneseBlackfeetBolivianBrazilianBritishBritish West IndianBulgarianBurmeseCajunCambodianCanadianCape VerdeanCarpatho RusynCelticCentral AmericanCentral American IndianCherokeeCheyenneChickasawChileanChineseChippewaChoctawColombianColvilleComancheCosta RicanCreeCreekCroatianCrowCubanCypriotCzechCzechoslovakianDanishDelawareDominicanDutchDutch West IndianEastern EuropeanEcuadorianEgyptianEnglishEstonianEthiopianEuropeanFijianFilipinoFinnishFrenchFrench American IndianFrench CanadianGermanGerman RussianGhanaianGreekGuamanian/ChamorroGuatemalanGuyaneseHaitianHmongHonduranHopiHoumaHungarianIcelanderIndian (Asian)IndonesianInupiatIranianIraqiIrishIroquoisIsraeliItalianJamaicanJapaneseJordanianKenyanKiowaKoreanLaotianLatvianLebaneseLiberianLithuanianLumbeeLuxembourgerMacedonianMalaysianMalteseMarshalleseMenomineeMexicanMexican American IndianMongolianMoroccanNative HawaiianNavajoNepaleseNew ZealanderNicaraguanNigerianNorthern EuropeanNorwegianOkinawanOsageOttawaPaiutePakistaniPalestinianPanamanianParaguayanPennsylvania GermanPeruvianPimaPolishPortuguesePotawatomiPuebloPuerto RicanPuget Sound SalishRomanianRussianSalvadoranSamoanScandinavianScotch-IrishScottishSeminoleSenegaleseSerbianShoshoneSierra LeoneanSiouxSlavicSlovakSloveneSomaliSouth AfricanSouth AmericanSouth American IndianSoviet UnionSpaniardSpanishSpanish AmericanSpanish American IndianSri LankanSubsaharan AfricanSudaneseSwedishSwissSyrianTaiwaneseThaiTlingit-HaidaTohono O'OdhamTonganTrinidadian and TobagonianTsimshianTurkishU.S. Virgin IslanderUgandanUkrainianUruguayanUteVenezuelanVietnameseWelshWest IndianYakamaYaquiYugoslavianYumanYup'ikZimbabwean
Immigration
NonimmigrantsImmigrantsAfghanistanAfricaAlbaniaArgentinaArmeniaAsiaAustraliaAustriaBahamasBangladeshBarbadosBelarusBelgiumBelizeBoliviaBosnia and HerzegovinaBrazilBulgariaBurma/MyanmarCabo VerdeCambodiaCameroonCanadaCaribbeanCentral AmericaChileChinaColombiaCongoCosta RicaCroatiaCubaCzechoslovakiaDenmarkDominicaDominican RepublicEastern AfricaEastern AsiaEastern EuropeEcuadorEgyptEl SalvadorEnglandEritreaEthiopiaEuropeFijiFranceGermanyGhanaGreeceGrenadaGuatemalaGuyanaHaitiHondurasHong KongHungaryIndiaIndonesiaIranIraqIrelandIsraelItalyJamaicaJapanJordanKazakhstanKenyaKoreaKuwaitLaosLatin AmericaLatviaLebanonLiberiaLithuaniaMalaysiaMexicoMicronesiaMiddle AfricaMoldovaMoroccoNepalNetherlandsNicaraguaNigeriaNorth AmericaNorth MacedoniaNorthern AfricaNorthern EuropeNorwayOceaniaPakistanPanamaPeruPhilippinesPolandPortugalRomaniaRussiaSaudi ArabiaScotlandSenegalSerbiaSierra LeoneSingaporeSomaliaSouth AfricaSouth AmericaSouth Central AsiaSouth Eastern AsiaSouthern EuropeSpainSri LankaSt. Vincent and the GrenadinesSudanSwedenSwitzerlandSyriaTaiwanThailandTrinidad and TobagoTurkeyUgandaUkraineUruguayUzbekistanVenezuelaVietnamWest IndiesWestern AfricaWestern AsiaWestern EuropeYemenZaireZimbabweAzores
Married-Couple Family Poverty
Income
Poverty
Unemployment
Labor Participation
Family Structure
Vehicle Availability
Education Level
Disability

Belizean Married-Couple Family Poverty
Tragic

6.5%
POVERTY | MARRIED-COUPLE FAMILIES
0.0/ 100
METRIC RATING
291st/ 347
METRIC RANK

Belizean Married-Couple Family Poverty Correlation Chart

The statistical analysis conducted on geographies consisting of 143,932,988 people shows no correlation between the proportion of Belizeans and poverty level among married-couple families in the United States with a correlation coefficient (R) of 0.013 and weighted average of 6.5%. On average, for every 1% (one percent) increase in Belizeans within a typical geography, there is an increase of 0.025% in poverty level among married-couple families.
Belizean Married-Couple Family Poverty
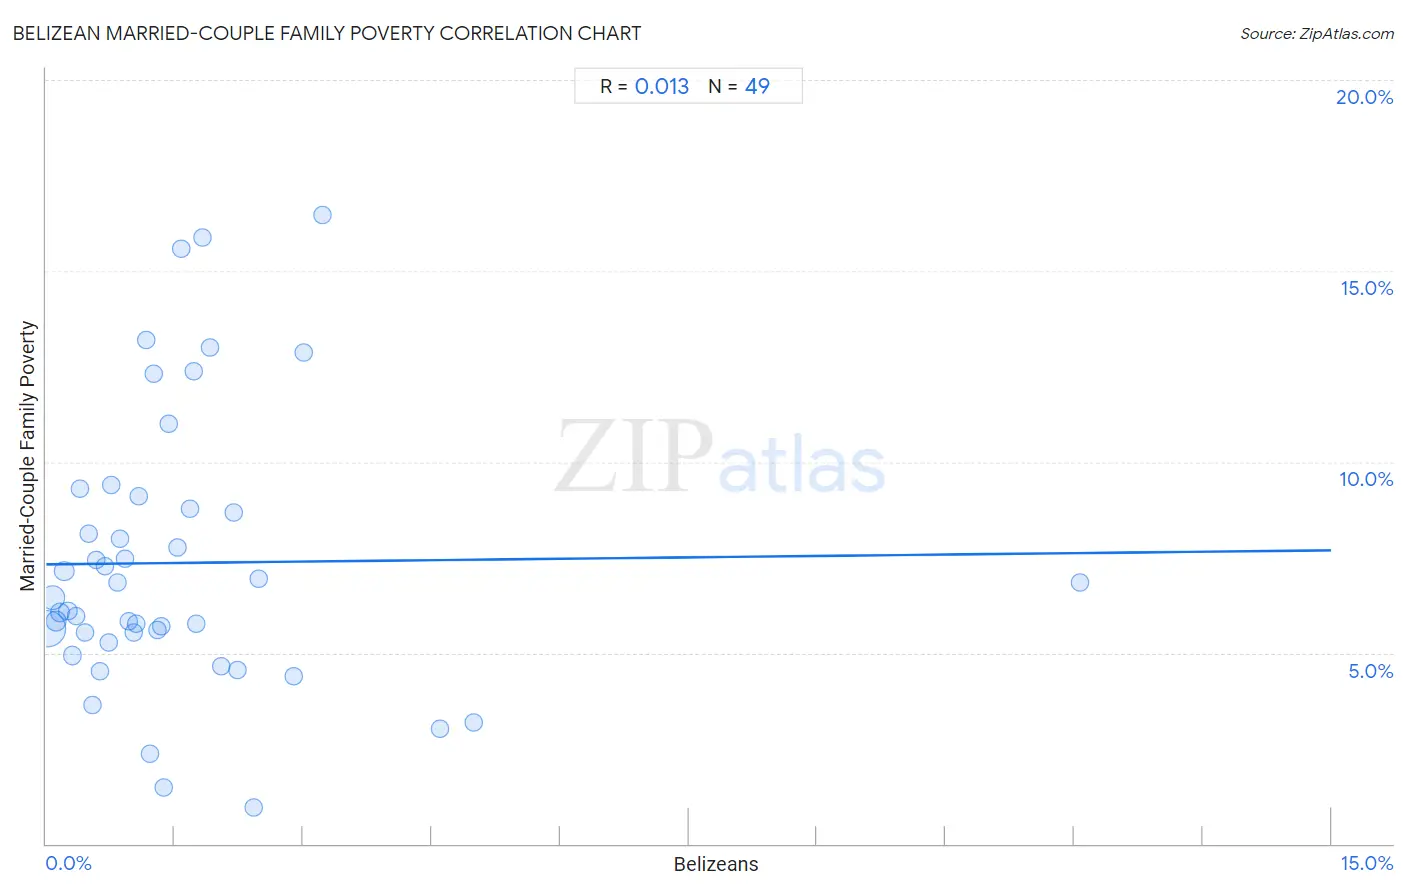
It is essential to understand that the correlation between the percentage of Belizeans and poverty level among married-couple families does not imply a direct cause-and-effect relationship. It remains uncertain whether the presence of Belizeans influences an upward or downward trend in the level of poverty level among married-couple families within an area, or if Belizeans simply ended up residing in those areas with higher or lower levels of poverty level among married-couple families due to other factors.

Demographics Similar to Belizeans by Married-Couple Family Poverty

In terms of married-couple family poverty, the demographic groups most similar to Belizeans are Immigrants from Barbados (6.5%, a difference of 0.040%), Immigrants from Lebanon (6.6%, a difference of 0.17%), Nepalese (6.5%, a difference of 0.26%), Arapaho (6.6%, a difference of 0.26%), and Salvadoran (6.5%, a difference of 0.44%).
DemographicsRating | RankMarried-Couple Family Poverty
Dutch West Indians
0.0
/100
|
#284
Tragic
6.4%
Blacks/African Americans
0.0
/100
|
#285
Tragic
6.5%
Guyanese
0.0
/100
|
#286
Tragic
6.5%
Ecuadorians
0.0
/100
|
#287
Tragic
6.5%
Salvadorans
0.0
/100
|
#288
Tragic
6.5%
Nepalese
0.0
/100
|
#289
Tragic
6.5%
Immigrants from Barbados
0.0
/100
|
#290
Tragic
6.5%
Belizeans
0.0
/100
|
#291
Tragic
6.5%
Immigrants from Lebanon
0.0
/100
|
#292
Tragic
6.6%
Arapaho
0.0
/100
|
#293
Tragic
6.6%
Bahamians
0.0
/100
|
#294
Tragic
6.6%
Immigrants from Uzbekistan
0.0
/100
|
#295
Tragic
6.6%
U.S. Virgin Islanders
0.0
/100
|
#296
Tragic
6.6%
Kiowa
0.0
/100
|
#297
Tragic
6.6%
Immigrants from Guyana
0.0
/100
|
#298
Tragic
6.7%

Belizean Married-Couple Family Poverty Correlation Summary

MeasurementBelizean DataMarried-Couple Family Poverty Data
Minimum0.018%0.96%
Maximum12.1%16.5%
Range12.0%15.5%
Mean1.6%7.4%
Median1.2%6.5%
Interquartile 25% (IQ1)0.56%5.4%
Interquartile 75% (IQ3)1.9%8.9%
Interquartile Range (IQR)1.3%3.5%
Standard Deviation (Sample)1.9%3.6%
Standard Deviation (Population)1.9%3.6%

Correlation Details

Belizean PercentileSample SizeMarried-Couple Family Poverty
[
0.0%
-
0.5%
]
0.018%
83,028,0595.6%
[
0.0%
-
0.5%
]
0.073%
26,188,0936.5%
[
0.0%
-
0.5%
]
0.11%
12,795,0175.8%
[
0.0%
-
0.5%
]
0.16%
5,919,6936.1%
[
0.0%
-
0.5%
]
0.21%
6,764,4507.2%
[
0.0%
-
0.5%
]
0.25%
2,314,5596.1%
[
0.0%
-
0.5%
]
0.31%
1,266,2734.9%
[
0.0%
-
0.5%
]
0.35%
1,560,1706.0%
[
0.0%
-
0.5%
]
0.40%
560,4939.3%
[
0.0%
-
0.5%
]
0.45%
309,3475.5%
[
0.0%
-
0.5%
]
0.49%
602,6328.1%
[
0.5%
-
1.0%
]
0.54%
135,9213.6%
[
0.5%
-
1.0%
]
0.58%
454,5467.4%
[
0.5%
-
1.0%
]
0.63%
111,0574.5%
[
0.5%
-
1.0%
]
0.69%
165,1747.3%
[
0.5%
-
1.0%
]
0.72%
182,5665.3%
[
0.5%
-
1.0%
]
0.76%
98,6099.4%
[
0.5%
-
1.0%
]
0.83%
106,8946.8%
[
0.5%
-
1.0%
]
0.87%
163,4758.0%
[
0.5%
-
1.0%
]
0.93%
78,6127.5%
[
0.5%
-
1.0%
]
0.97%
175,9795.8%
[
1.0%
-
1.5%
]
1.03%
64,8655.5%
[
1.0%
-
1.5%
]
1.05%
42,1685.8%
[
1.0%
-
1.5%
]
1.09%
117,8679.1%
[
1.0%
-
1.5%
]
1.16%
19,50213.2%
[
1.0%
-
1.5%
]
1.21%
18,0512.3%
[
1.0%
-
1.5%
]
1.25%
86,67312.3%
[
1.0%
-
1.5%
]
1.29%
88,9405.6%
[
1.0%
-
1.5%
]
1.34%
64,8025.7%
[
1.0%
-
1.5%
]
1.37%
1,9661.5%
[
1.0%
-
1.5%
]
1.44%
4,94611.0%
[
1.5%
-
2.0%
]
1.53%
115,8587.7%
[
1.5%
-
2.0%
]
1.57%
15,47615.6%
[
1.5%
-
2.0%
]
1.68%
32,2298.8%
[
1.5%
-
2.0%
]
1.72%
50,02412.4%
[
1.5%
-
2.0%
]
1.75%
43,0925.8%
[
1.5%
-
2.0%
]
1.82%
12,65115.9%
[
1.5%
-
2.0%
]
1.92%
49,89813.0%
[
2.0%
-
2.5%
]
2.04%
7,7024.7%
[
2.0%
-
2.5%
]
2.19%
18,3608.7%
[
2.0%
-
2.5%
]
2.23%
22,0594.5%
[
2.0%
-
2.5%
]
2.42%
20,3360.96%
[
2.0%
-
2.5%
]
2.48%
45,3226.9%
[
2.5%
-
3.0%
]
2.89%
1,1064.4%
[
3.0%
-
3.5%
]
3.00%
1,93212.9%
[
3.0%
-
3.5%
]
3.22%
1,48916.5%
[
4.5%
-
5.0%
]
4.60%
2,7393.0%
[
4.5%
-
5.0%
]
4.99%
4213.2%
[
12.0%
-
12.5%
]
12.07%
8956.8%