Belizean Unemployment Among Women with Children Ages 6 to 17 years

COMPARE

Belizean
Race
Ancestry
AfghanAfricanAlaska NativeAlaskan AthabascanAlbanianAleutAlsatianAmericanApacheArabArapahoArgentineanArmenianAssyrian/Chaldean/SyriacAustralianAustrianBahamianBangladeshiBarbadianBasqueBelgianBelizeanBermudanBhutaneseBlackfeetBolivianBrazilianBritishBritish West IndianBulgarianBurmeseCajunCambodianCanadianCape VerdeanCarpatho RusynCelticCentral AmericanCentral American IndianCherokeeCheyenneChickasawChileanChineseChippewaChoctawColombianColvilleComancheCosta RicanCreeCreekCroatianCrowCubanCypriotCzechCzechoslovakianDanishDelawareDominicanDutchDutch West IndianEastern EuropeanEcuadorianEgyptianEnglishEstonianEthiopianEuropeanFijianFilipinoFinnishFrenchFrench American IndianFrench CanadianGermanGerman RussianGhanaianGreekGuamanian/ChamorroGuatemalanGuyaneseHaitianHmongHonduranHopiHoumaHungarianIcelanderIndian (Asian)IndonesianInupiatIranianIraqiIrishIroquoisIsraeliItalianJamaicanJapaneseJordanianKenyanKiowaKoreanLaotianLatvianLebaneseLiberianLithuanianLumbeeLuxembourgerMacedonianMalaysianMalteseMarshalleseMenomineeMexicanMexican American IndianMongolianMoroccanNative HawaiianNavajoNepaleseNew ZealanderNicaraguanNigerianNorthern EuropeanNorwegianOkinawanOsageOttawaPaiutePakistaniPalestinianPanamanianParaguayanPennsylvania GermanPeruvianPimaPolishPortuguesePotawatomiPuebloPuerto RicanPuget Sound SalishRomanianRussianSalvadoranSamoanScandinavianScotch-IrishScottishSeminoleSenegaleseSerbianShoshoneSierra LeoneanSiouxSlavicSlovakSloveneSomaliSouth AfricanSouth AmericanSouth American IndianSoviet UnionSpaniardSpanishSpanish AmericanSpanish American IndianSri LankanSubsaharan AfricanSudaneseSwedishSwissSyrianTaiwaneseThaiTlingit-HaidaTohono O'OdhamTonganTrinidadian and TobagonianTsimshianTurkishU.S. Virgin IslanderUgandanUkrainianUruguayanUteVenezuelanVietnameseWelshWest IndianYakamaYaquiYugoslavianYumanYup'ikZimbabwean
Immigration
NonimmigrantsImmigrantsAfghanistanAfricaAlbaniaArgentinaArmeniaAsiaAustraliaAustriaBahamasBangladeshBarbadosBelarusBelgiumBelizeBoliviaBosnia and HerzegovinaBrazilBulgariaBurma/MyanmarCabo VerdeCambodiaCameroonCanadaCaribbeanCentral AmericaChileChinaColombiaCongoCosta RicaCroatiaCubaCzechoslovakiaDenmarkDominicaDominican RepublicEastern AfricaEastern AsiaEastern EuropeEcuadorEgyptEl SalvadorEnglandEritreaEthiopiaEuropeFijiFranceGermanyGhanaGreeceGrenadaGuatemalaGuyanaHaitiHondurasHong KongHungaryIndiaIndonesiaIranIraqIrelandIsraelItalyJamaicaJapanJordanKazakhstanKenyaKoreaKuwaitLaosLatin AmericaLatviaLebanonLiberiaLithuaniaMalaysiaMexicoMicronesiaMiddle AfricaMoldovaMoroccoNepalNetherlandsNicaraguaNigeriaNorth AmericaNorth MacedoniaNorthern AfricaNorthern EuropeNorwayOceaniaPakistanPanamaPeruPhilippinesPolandPortugalRomaniaRussiaSaudi ArabiaScotlandSenegalSerbiaSierra LeoneSingaporeSomaliaSouth AfricaSouth AmericaSouth Central AsiaSouth Eastern AsiaSouthern EuropeSpainSri LankaSt. Vincent and the GrenadinesSudanSwedenSwitzerlandSyriaTaiwanThailandTrinidad and TobagoTurkeyUgandaUkraineUruguayUzbekistanVenezuelaVietnamWest IndiesWestern AfricaWestern AsiaWestern EuropeYemenZaireZimbabweAzores
Select to Compare
Race
Ancestry
AfghanAfricanAlaska NativeAlaskan AthabascanAlbanianAleutAlsatianAmericanApacheArabArapahoArgentineanArmenianAssyrian/Chaldean/SyriacAustralianAustrianBahamianBangladeshiBarbadianBasqueBelgianBermudanBhutaneseBlackfeetBolivianBrazilianBritishBritish West IndianBulgarianBurmeseCajunCambodianCanadianCape VerdeanCarpatho RusynCelticCentral AmericanCentral American IndianCherokeeCheyenneChickasawChileanChineseChippewaChoctawColombianColvilleComancheCosta RicanCreeCreekCroatianCrowCubanCypriotCzechCzechoslovakianDanishDelawareDominicanDutchDutch West IndianEastern EuropeanEcuadorianEgyptianEnglishEstonianEthiopianEuropeanFijianFilipinoFinnishFrenchFrench American IndianFrench CanadianGermanGerman RussianGhanaianGreekGuamanian/ChamorroGuatemalanGuyaneseHaitianHmongHonduranHopiHoumaHungarianIcelanderIndian (Asian)IndonesianInupiatIranianIraqiIrishIroquoisIsraeliItalianJamaicanJapaneseJordanianKenyanKiowaKoreanLaotianLatvianLebaneseLiberianLithuanianLumbeeLuxembourgerMacedonianMalaysianMalteseMarshalleseMenomineeMexicanMexican American IndianMongolianMoroccanNative HawaiianNavajoNepaleseNew ZealanderNicaraguanNigerianNorthern EuropeanNorwegianOkinawanOsageOttawaPaiutePakistaniPalestinianPanamanianParaguayanPennsylvania GermanPeruvianPimaPolishPortuguesePotawatomiPuebloPuerto RicanPuget Sound SalishRomanianRussianSalvadoranSamoanScandinavianScotch-IrishScottishSeminoleSenegaleseSerbianShoshoneSierra LeoneanSiouxSlavicSlovakSloveneSomaliSouth AfricanSouth AmericanSouth American IndianSoviet UnionSpaniardSpanishSpanish AmericanSpanish American IndianSri LankanSubsaharan AfricanSudaneseSwedishSwissSyrianTaiwaneseThaiTlingit-HaidaTohono O'OdhamTonganTrinidadian and TobagonianTsimshianTurkishU.S. Virgin IslanderUgandanUkrainianUruguayanUteVenezuelanVietnameseWelshWest IndianYakamaYaquiYugoslavianYumanYup'ikZimbabwean
Immigration
NonimmigrantsImmigrantsAfghanistanAfricaAlbaniaArgentinaArmeniaAsiaAustraliaAustriaBahamasBangladeshBarbadosBelarusBelgiumBelizeBoliviaBosnia and HerzegovinaBrazilBulgariaBurma/MyanmarCabo VerdeCambodiaCameroonCanadaCaribbeanCentral AmericaChileChinaColombiaCongoCosta RicaCroatiaCubaCzechoslovakiaDenmarkDominicaDominican RepublicEastern AfricaEastern AsiaEastern EuropeEcuadorEgyptEl SalvadorEnglandEritreaEthiopiaEuropeFijiFranceGermanyGhanaGreeceGrenadaGuatemalaGuyanaHaitiHondurasHong KongHungaryIndiaIndonesiaIranIraqIrelandIsraelItalyJamaicaJapanJordanKazakhstanKenyaKoreaKuwaitLaosLatin AmericaLatviaLebanonLiberiaLithuaniaMalaysiaMexicoMicronesiaMiddle AfricaMoldovaMoroccoNepalNetherlandsNicaraguaNigeriaNorth AmericaNorth MacedoniaNorthern AfricaNorthern EuropeNorwayOceaniaPakistanPanamaPeruPhilippinesPolandPortugalRomaniaRussiaSaudi ArabiaScotlandSenegalSerbiaSierra LeoneSingaporeSomaliaSouth AfricaSouth AmericaSouth Central AsiaSouth Eastern AsiaSouthern EuropeSpainSri LankaSt. Vincent and the GrenadinesSudanSwedenSwitzerlandSyriaTaiwanThailandTrinidad and TobagoTurkeyUgandaUkraineUruguayUzbekistanVenezuelaVietnamWest IndiesWestern AfricaWestern AsiaWestern EuropeYemenZaireZimbabweAzores
Unemployment Among Women with Children Ages 6 to 17 years
Income
Poverty
Unemployment
Labor Participation
Family Structure
Vehicle Availability
Education Level
Disability

Belizean Unemployment Among Women with Children Ages 6 to 17 years
Fair

9.1%
UNEMPLOYMENT | WOMEN W/ CHILDREN 6 TO 17
28.4/ 100
METRIC RATING
191st/ 347
METRIC RANK

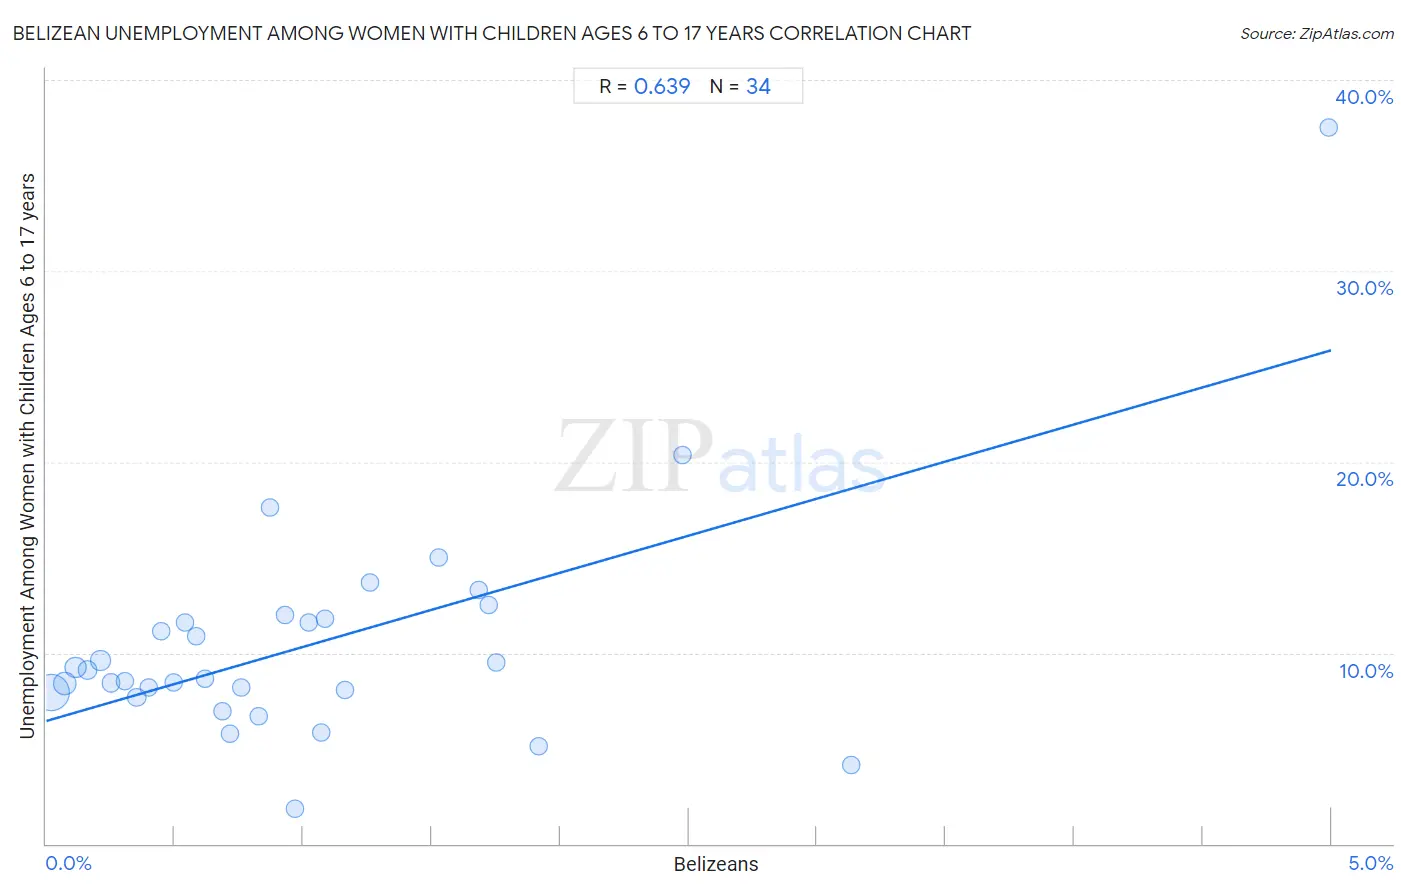
Belizean Unemployment Among Women with Children Ages 6 to 17 years Correlation Chart

The statistical analysis conducted on geographies consisting of 125,536,739 people shows a significant positive correlation between the proportion of Belizeans and unemployment rate among women with children between the ages 6 and 17 in the United States with a correlation coefficient (R) of 0.639 and weighted average of 9.1%. On average, for every 1% (one percent) increase in Belizeans within a typical geography, there is an increase of 3.9% in unemployment rate among women with children between the ages 6 and 17.
Belizean Unemployment Among Women with Children Ages 6 to 17 years
It is essential to understand that the correlation between the percentage of Belizeans and unemployment rate among women with children between the ages 6 and 17 does not imply a direct cause-and-effect relationship. It remains uncertain whether the presence of Belizeans influences an upward or downward trend in the level of unemployment rate among women with children between the ages 6 and 17 within an area, or if Belizeans simply ended up residing in those areas with higher or lower levels of unemployment rate among women with children between the ages 6 and 17 due to other factors.

Demographics Similar to Belizeans by Unemployment Among Women with Children Ages 6 to 17 years

In terms of unemployment among women with children ages 6 to 17 years, the demographic groups most similar to Belizeans are Slovene (9.1%, a difference of 0.0%), Immigrants (9.1%, a difference of 0.040%), Immigrants from Syria (9.1%, a difference of 0.070%), Guamanian/Chamorro (9.1%, a difference of 0.070%), and Comanche (9.0%, a difference of 0.080%).
DemographicsRating | RankUnemployment Among Women with Children Ages 6 to 17 years
Palestinians
33.4
/100
|
#184
Fair
9.0%
Immigrants from Congo
32.5
/100
|
#185
Fair
9.0%
Immigrants from Spain
32.4
/100
|
#186
Fair
9.0%
Comanche
30.0
/100
|
#187
Fair
9.0%
Immigrants from Syria
29.7
/100
|
#188
Fair
9.1%
Immigrants
29.2
/100
|
#189
Fair
9.1%
Slovenes
28.5
/100
|
#190
Fair
9.1%
Belizeans
28.4
/100
|
#191
Fair
9.1%
Guamanians/Chamorros
27.2
/100
|
#192
Fair
9.1%
Immigrants from Turkey
25.8
/100
|
#193
Fair
9.1%
Immigrants from Kazakhstan
25.3
/100
|
#194
Fair
9.1%
Austrians
25.0
/100
|
#195
Fair
9.1%
Brazilians
24.4
/100
|
#196
Fair
9.1%
Immigrants from Panama
24.3
/100
|
#197
Fair
9.1%
Guyanese
21.8
/100
|
#198
Fair
9.1%

Belizean Unemployment Among Women with Children Ages 6 to 17 years Correlation Summary

MeasurementBelizean DataUnemployment Among Women with Children Ages 6 to 17 years Data
Minimum0.017%1.8%
Maximum5.0%37.5%
Range5.0%35.7%
Mean1.0%10.4%
Median0.79%8.9%
Interquartile 25% (IQ1)0.40%8.0%
Interquartile 75% (IQ3)1.3%11.8%
Interquartile Range (IQR)0.86%3.8%
Standard Deviation (Sample)0.99%6.0%
Standard Deviation (Population)0.98%5.9%

Correlation Details

Belizean PercentileSample SizeUnemployment Among Women with Children Ages 6 to 17 years
[
0.0%
-
0.5%
]
0.017%
75,727,8348.0%
[
0.0%
-
0.5%
]
0.074%
21,954,7718.4%
[
0.0%
-
0.5%
]
0.11%
10,718,3669.2%
[
0.0%
-
0.5%
]
0.16%
4,678,0519.1%
[
0.0%
-
0.5%
]
0.21%
5,916,1699.6%
[
0.0%
-
0.5%
]
0.25%
1,780,3838.4%
[
0.0%
-
0.5%
]
0.31%
944,0148.5%
[
0.0%
-
0.5%
]
0.35%
1,160,3607.7%
[
0.0%
-
0.5%
]
0.40%
387,9208.2%
[
0.0%
-
0.5%
]
0.45%
177,56811.1%
[
0.0%
-
0.5%
]
0.49%
460,0728.4%
[
0.5%
-
1.0%
]
0.54%
53,93011.6%
[
0.5%
-
1.0%
]
0.59%
319,50010.9%
[
0.5%
-
1.0%
]
0.62%
64,1158.6%
[
0.5%
-
1.0%
]
0.69%
102,3427.0%
[
0.5%
-
1.0%
]
0.72%
107,2535.8%
[
0.5%
-
1.0%
]
0.76%
29,8338.2%
[
0.5%
-
1.0%
]
0.83%
103,1126.7%
[
0.5%
-
1.0%
]
0.87%
75,02417.6%
[
0.5%
-
1.0%
]
0.93%
47,92412.0%
[
0.5%
-
1.0%
]
0.97%
149,8121.8%
[
1.0%
-
1.5%
]
1.02%
58,78211.6%
[
1.0%
-
1.5%
]
1.07%
6,4535.8%
[
1.0%
-
1.5%
]
1.09%
106,80611.8%
[
1.0%
-
1.5%
]
1.16%
14,7738.0%
[
1.0%
-
1.5%
]
1.26%
69,06413.7%
[
1.5%
-
2.0%
]
1.53%
111,80415.0%
[
1.5%
-
2.0%
]
1.68%
29,30713.3%
[
1.5%
-
2.0%
]
1.72%
50,02412.5%
[
1.5%
-
2.0%
]
1.75%
33,5289.5%
[
1.5%
-
2.0%
]
1.92%
49,8985.1%
[
2.0%
-
2.5%
]
2.48%
45,32220.3%
[
3.0%
-
3.5%
]
3.13%
2,2044.1%
[
4.5%
-
5.0%
]
4.99%
42137.5%