Belizean 3 or more Vehicles in Household

COMPARE

Belizean
Race
Ancestry
AfghanAfricanAlaska NativeAlaskan AthabascanAlbanianAleutAlsatianAmericanApacheArabArapahoArgentineanArmenianAssyrian/Chaldean/SyriacAustralianAustrianBahamianBangladeshiBarbadianBasqueBelgianBelizeanBermudanBhutaneseBlackfeetBolivianBrazilianBritishBritish West IndianBulgarianBurmeseCajunCambodianCanadianCape VerdeanCarpatho RusynCelticCentral AmericanCentral American IndianCherokeeCheyenneChickasawChileanChineseChippewaChoctawColombianColvilleComancheCosta RicanCreeCreekCroatianCrowCubanCypriotCzechCzechoslovakianDanishDelawareDominicanDutchDutch West IndianEastern EuropeanEcuadorianEgyptianEnglishEstonianEthiopianEuropeanFijianFilipinoFinnishFrenchFrench American IndianFrench CanadianGermanGerman RussianGhanaianGreekGuamanian/ChamorroGuatemalanGuyaneseHaitianHmongHonduranHopiHoumaHungarianIcelanderIndian (Asian)IndonesianInupiatIranianIraqiIrishIroquoisIsraeliItalianJamaicanJapaneseJordanianKenyanKiowaKoreanLaotianLatvianLebaneseLiberianLithuanianLumbeeLuxembourgerMacedonianMalaysianMalteseMarshalleseMenomineeMexicanMexican American IndianMongolianMoroccanNative HawaiianNavajoNepaleseNew ZealanderNicaraguanNigerianNorthern EuropeanNorwegianOkinawanOsageOttawaPaiutePakistaniPalestinianPanamanianParaguayanPennsylvania GermanPeruvianPimaPolishPortuguesePotawatomiPuebloPuerto RicanPuget Sound SalishRomanianRussianSalvadoranSamoanScandinavianScotch-IrishScottishSeminoleSenegaleseSerbianShoshoneSierra LeoneanSiouxSlavicSlovakSloveneSomaliSouth AfricanSouth AmericanSouth American IndianSoviet UnionSpaniardSpanishSpanish AmericanSpanish American IndianSri LankanSubsaharan AfricanSudaneseSwedishSwissSyrianTaiwaneseThaiTlingit-HaidaTohono O'OdhamTonganTrinidadian and TobagonianTsimshianTurkishU.S. Virgin IslanderUgandanUkrainianUruguayanUteVenezuelanVietnameseWelshWest IndianYakamaYaquiYugoslavianYumanYup'ikZimbabwean
Immigration
NonimmigrantsImmigrantsAfghanistanAfricaAlbaniaArgentinaArmeniaAsiaAustraliaAustriaBahamasBangladeshBarbadosBelarusBelgiumBelizeBoliviaBosnia and HerzegovinaBrazilBulgariaBurma/MyanmarCabo VerdeCambodiaCameroonCanadaCaribbeanCentral AmericaChileChinaColombiaCongoCosta RicaCroatiaCubaCzechoslovakiaDenmarkDominicaDominican RepublicEastern AfricaEastern AsiaEastern EuropeEcuadorEgyptEl SalvadorEnglandEritreaEthiopiaEuropeFijiFranceGermanyGhanaGreeceGrenadaGuatemalaGuyanaHaitiHondurasHong KongHungaryIndiaIndonesiaIranIraqIrelandIsraelItalyJamaicaJapanJordanKazakhstanKenyaKoreaKuwaitLaosLatin AmericaLatviaLebanonLiberiaLithuaniaMalaysiaMexicoMicronesiaMiddle AfricaMoldovaMoroccoNepalNetherlandsNicaraguaNigeriaNorth AmericaNorth MacedoniaNorthern AfricaNorthern EuropeNorwayOceaniaPakistanPanamaPeruPhilippinesPolandPortugalRomaniaRussiaSaudi ArabiaScotlandSenegalSerbiaSierra LeoneSingaporeSomaliaSouth AfricaSouth AmericaSouth Central AsiaSouth Eastern AsiaSouthern EuropeSpainSri LankaSt. Vincent and the GrenadinesSudanSwedenSwitzerlandSyriaTaiwanThailandTrinidad and TobagoTurkeyUgandaUkraineUruguayUzbekistanVenezuelaVietnamWest IndiesWestern AfricaWestern AsiaWestern EuropeYemenZaireZimbabweAzores
Select to Compare
Race
Ancestry
AfghanAfricanAlaska NativeAlaskan AthabascanAlbanianAleutAlsatianAmericanApacheArabArapahoArgentineanArmenianAssyrian/Chaldean/SyriacAustralianAustrianBahamianBangladeshiBarbadianBasqueBelgianBermudanBhutaneseBlackfeetBolivianBrazilianBritishBritish West IndianBulgarianBurmeseCajunCambodianCanadianCape VerdeanCarpatho RusynCelticCentral AmericanCentral American IndianCherokeeCheyenneChickasawChileanChineseChippewaChoctawColombianColvilleComancheCosta RicanCreeCreekCroatianCrowCubanCypriotCzechCzechoslovakianDanishDelawareDominicanDutchDutch West IndianEastern EuropeanEcuadorianEgyptianEnglishEstonianEthiopianEuropeanFijianFilipinoFinnishFrenchFrench American IndianFrench CanadianGermanGerman RussianGhanaianGreekGuamanian/ChamorroGuatemalanGuyaneseHaitianHmongHonduranHopiHoumaHungarianIcelanderIndian (Asian)IndonesianInupiatIranianIraqiIrishIroquoisIsraeliItalianJamaicanJapaneseJordanianKenyanKiowaKoreanLaotianLatvianLebaneseLiberianLithuanianLumbeeLuxembourgerMacedonianMalaysianMalteseMarshalleseMenomineeMexicanMexican American IndianMongolianMoroccanNative HawaiianNavajoNepaleseNew ZealanderNicaraguanNigerianNorthern EuropeanNorwegianOkinawanOsageOttawaPaiutePakistaniPalestinianPanamanianParaguayanPennsylvania GermanPeruvianPimaPolishPortuguesePotawatomiPuebloPuerto RicanPuget Sound SalishRomanianRussianSalvadoranSamoanScandinavianScotch-IrishScottishSeminoleSenegaleseSerbianShoshoneSierra LeoneanSiouxSlavicSlovakSloveneSomaliSouth AfricanSouth AmericanSouth American IndianSoviet UnionSpaniardSpanishSpanish AmericanSpanish American IndianSri LankanSubsaharan AfricanSudaneseSwedishSwissSyrianTaiwaneseThaiTlingit-HaidaTohono O'OdhamTonganTrinidadian and TobagonianTsimshianTurkishU.S. Virgin IslanderUgandanUkrainianUruguayanUteVenezuelanVietnameseWelshWest IndianYakamaYaquiYugoslavianYumanYup'ikZimbabwean
Immigration
NonimmigrantsImmigrantsAfghanistanAfricaAlbaniaArgentinaArmeniaAsiaAustraliaAustriaBahamasBangladeshBarbadosBelarusBelgiumBelizeBoliviaBosnia and HerzegovinaBrazilBulgariaBurma/MyanmarCabo VerdeCambodiaCameroonCanadaCaribbeanCentral AmericaChileChinaColombiaCongoCosta RicaCroatiaCubaCzechoslovakiaDenmarkDominicaDominican RepublicEastern AfricaEastern AsiaEastern EuropeEcuadorEgyptEl SalvadorEnglandEritreaEthiopiaEuropeFijiFranceGermanyGhanaGreeceGrenadaGuatemalaGuyanaHaitiHondurasHong KongHungaryIndiaIndonesiaIranIraqIrelandIsraelItalyJamaicaJapanJordanKazakhstanKenyaKoreaKuwaitLaosLatin AmericaLatviaLebanonLiberiaLithuaniaMalaysiaMexicoMicronesiaMiddle AfricaMoldovaMoroccoNepalNetherlandsNicaraguaNigeriaNorth AmericaNorth MacedoniaNorthern AfricaNorthern EuropeNorwayOceaniaPakistanPanamaPeruPhilippinesPolandPortugalRomaniaRussiaSaudi ArabiaScotlandSenegalSerbiaSierra LeoneSingaporeSomaliaSouth AfricaSouth AmericaSouth Central AsiaSouth Eastern AsiaSouthern EuropeSpainSri LankaSt. Vincent and the GrenadinesSudanSwedenSwitzerlandSyriaTaiwanThailandTrinidad and TobagoTurkeyUgandaUkraineUruguayUzbekistanVenezuelaVietnamWest IndiesWestern AfricaWestern AsiaWestern EuropeYemenZaireZimbabweAzores
3 or more Vehicles in Household
Income
Poverty
Unemployment
Labor Participation
Family Structure
Vehicle Availability
Education Level
Disability

Belizean 3 or more Vehicles in Household
Tragic

18.6%
3+ VEHICLES AVAILABLE
7.3/ 100
METRIC RATING
222nd/ 347
METRIC RANK

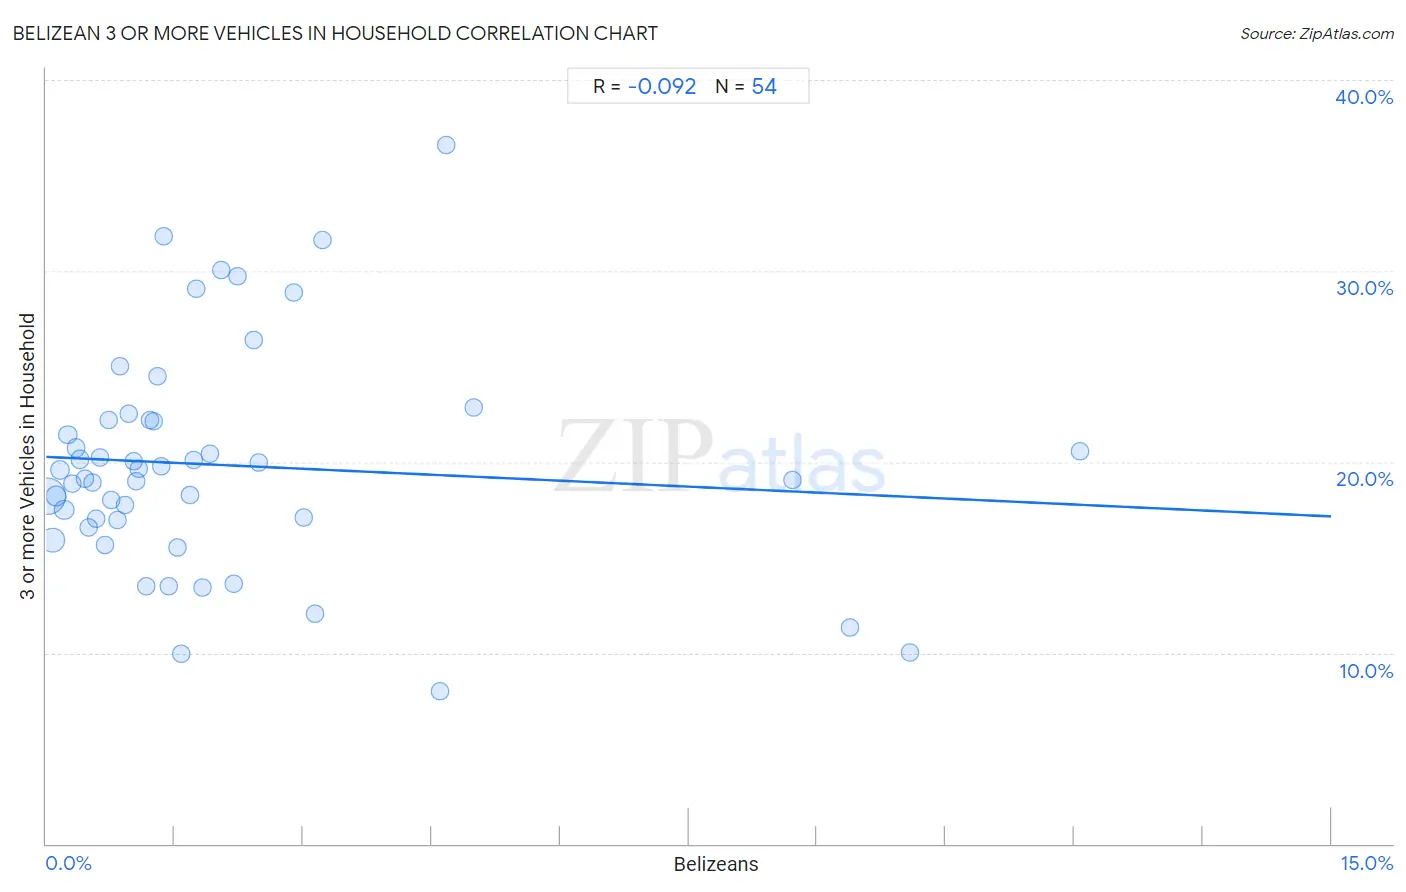
Belizean 3 or more Vehicles in Household Correlation Chart

The statistical analysis conducted on geographies consisting of 144,156,890 people shows a slight negative correlation between the proportion of Belizeans and percentage of households with 3 or more vehicles available in the United States with a correlation coefficient (R) of -0.092 and weighted average of 18.6%. On average, for every 1% (one percent) increase in Belizeans within a typical geography, there is a decrease of 0.21% in percentage of households with 3 or more vehicles available.
Belizean 3 or more Vehicles in Household
It is essential to understand that the correlation between the percentage of Belizeans and percentage of households with 3 or more vehicles available does not imply a direct cause-and-effect relationship. It remains uncertain whether the presence of Belizeans influences an upward or downward trend in the level of percentage of households with 3 or more vehicles available within an area, or if Belizeans simply ended up residing in those areas with higher or lower levels of percentage of households with 3 or more vehicles available due to other factors.

Demographics Similar to Belizeans by 3 or more Vehicles in Household

In terms of 3 or more vehicles in household, the demographic groups most similar to Belizeans are Immigrants from Poland (18.6%, a difference of 0.050%), Nigerian (18.6%, a difference of 0.15%), Immigrants from Armenia (18.6%, a difference of 0.34%), Immigrants from Portugal (18.6%, a difference of 0.43%), and Immigrants from Czechoslovakia (18.5%, a difference of 0.47%).
DemographicsRating | Rank3 or more Vehicles in Household
Eastern Europeans
10.6
/100
|
#215
Poor
18.7%
Immigrants from Nigeria
10.3
/100
|
#216
Poor
18.7%
Immigrants from Italy
10.2
/100
|
#217
Poor
18.7%
Immigrants from Portugal
8.9
/100
|
#218
Tragic
18.6%
Immigrants from Armenia
8.6
/100
|
#219
Tragic
18.6%
Nigerians
7.9
/100
|
#220
Tragic
18.6%
Immigrants from Poland
7.5
/100
|
#221
Tragic
18.6%
Belizeans
7.3
/100
|
#222
Tragic
18.6%
Immigrants from Czechoslovakia
5.9
/100
|
#223
Tragic
18.5%
Immigrants from Argentina
5.6
/100
|
#224
Tragic
18.5%
Immigrants from Lithuania
5.6
/100
|
#225
Tragic
18.5%
Immigrants from Hungary
5.5
/100
|
#226
Tragic
18.5%
Immigrants from Singapore
5.4
/100
|
#227
Tragic
18.4%
Turks
5.4
/100
|
#228
Tragic
18.4%
Immigrants from Switzerland
5.0
/100
|
#229
Tragic
18.4%

Belizean 3 or more Vehicles in Household Correlation Summary

MeasurementBelizean Data3 or more Vehicles in Household Data
Minimum0.018%8.0%
Maximum12.1%36.6%
Range12.0%28.6%
Mean2.1%19.8%
Median1.3%19.4%
Interquartile 25% (IQ1)0.63%17.0%
Interquartile 75% (IQ3)2.2%22.2%
Interquartile Range (IQR)1.6%5.2%
Standard Deviation (Sample)2.6%5.8%
Standard Deviation (Population)2.5%5.8%

Correlation Details

Belizean PercentileSample Size3 or more Vehicles in Household
[
0.0%
-
0.5%
]
0.018%
83,034,76118.2%
[
0.0%
-
0.5%
]
0.073%
26,239,81515.9%
[
0.0%
-
0.5%
]
0.11%
12,854,82118.2%
[
0.0%
-
0.5%
]
0.16%
5,939,05419.6%
[
0.0%
-
0.5%
]
0.21%
6,778,03017.5%
[
0.0%
-
0.5%
]
0.25%
2,320,82521.4%
[
0.0%
-
0.5%
]
0.31%
1,272,56118.8%
[
0.0%
-
0.5%
]
0.35%
1,560,17020.7%
[
0.0%
-
0.5%
]
0.40%
573,72620.1%
[
0.0%
-
0.5%
]
0.45%
310,70219.1%
[
0.0%
-
0.5%
]
0.49%
606,91616.6%
[
0.5%
-
1.0%
]
0.54%
138,23018.9%
[
0.5%
-
1.0%
]
0.58%
454,54617.0%
[
0.5%
-
1.0%
]
0.63%
111,05720.2%
[
0.5%
-
1.0%
]
0.69%
166,98215.6%
[
0.5%
-
1.0%
]
0.72%
182,56622.2%
[
0.5%
-
1.0%
]
0.76%
98,60918.0%
[
0.5%
-
1.0%
]
0.83%
109,66717.0%
[
0.5%
-
1.0%
]
0.87%
166,87925.0%
[
0.5%
-
1.0%
]
0.92%
89,19517.7%
[
0.5%
-
1.0%
]
0.97%
175,97922.5%
[
1.0%
-
1.5%
]
1.02%
76,33820.0%
[
1.0%
-
1.5%
]
1.05%
44,09319.0%
[
1.0%
-
1.5%
]
1.09%
117,86719.6%
[
1.0%
-
1.5%
]
1.16%
19,50213.5%
[
1.0%
-
1.5%
]
1.21%
18,05122.2%
[
1.0%
-
1.5%
]
1.25%
86,67322.1%
[
1.0%
-
1.5%
]
1.29%
88,94024.5%
[
1.0%
-
1.5%
]
1.34%
67,58019.8%
[
1.0%
-
1.5%
]
1.37%
1,96631.8%
[
1.0%
-
1.5%
]
1.44%
4,94613.5%
[
1.5%
-
2.0%
]
1.53%
115,85815.5%
[
1.5%
-
2.0%
]
1.57%
15,4769.9%
[
1.5%
-
2.0%
]
1.68%
32,22918.2%
[
1.5%
-
2.0%
]
1.72%
50,02420.1%
[
1.5%
-
2.0%
]
1.75%
43,09229.1%
[
1.5%
-
2.0%
]
1.82%
12,65113.4%
[
1.5%
-
2.0%
]
1.92%
49,89820.4%
[
2.0%
-
2.5%
]
2.04%
7,70230.1%
[
2.0%
-
2.5%
]
2.19%
18,36013.6%
[
2.0%
-
2.5%
]
2.23%
22,05929.7%
[
2.0%
-
2.5%
]
2.42%
20,33626.4%
[
2.0%
-
2.5%
]
2.48%
45,32219.9%
[
2.5%
-
3.0%
]
2.89%
1,10628.9%
[
3.0%
-
3.5%
]
3.00%
1,93217.1%
[
3.0%
-
3.5%
]
3.13%
2,20412.0%
[
3.0%
-
3.5%
]
3.22%
1,48931.6%
[
4.5%
-
5.0%
]
4.60%
2,7398.0%
[
4.5%
-
5.0%
]
4.68%
77036.6%
[
4.5%
-
5.0%
]
4.99%
42122.8%
[
8.5%
-
9.0%
]
8.71%
1,03319.1%
[
9.0%
-
9.5%
]
9.38%
12811.3%
[
10.0%
-
10.5%
]
10.08%
11910.0%
[
12.0%
-
12.5%
]
12.07%
89520.6%