Belgian Wage/Income Gap
COMPARE
Belgian
Select to Compare
Wage/Income Gap
Belgian Wage/Income Gap
28.8%
WAGE/INCOME GAP
0.1/ 100
METRIC RATING
317th/ 347
METRIC RANK
Belgian Wage/Income Gap Correlation Chart
The statistical analysis conducted on geographies consisting of 355,768,558 people shows a slight positive correlation between the proportion of Belgians and wage/income gap percentage in the United States with a correlation coefficient (R) of 0.068 and weighted average of 28.8%. On average, for every 1% (one percent) increase in Belgians within a typical geography, there is an increase of 0.048% in wage/income gap percentage.
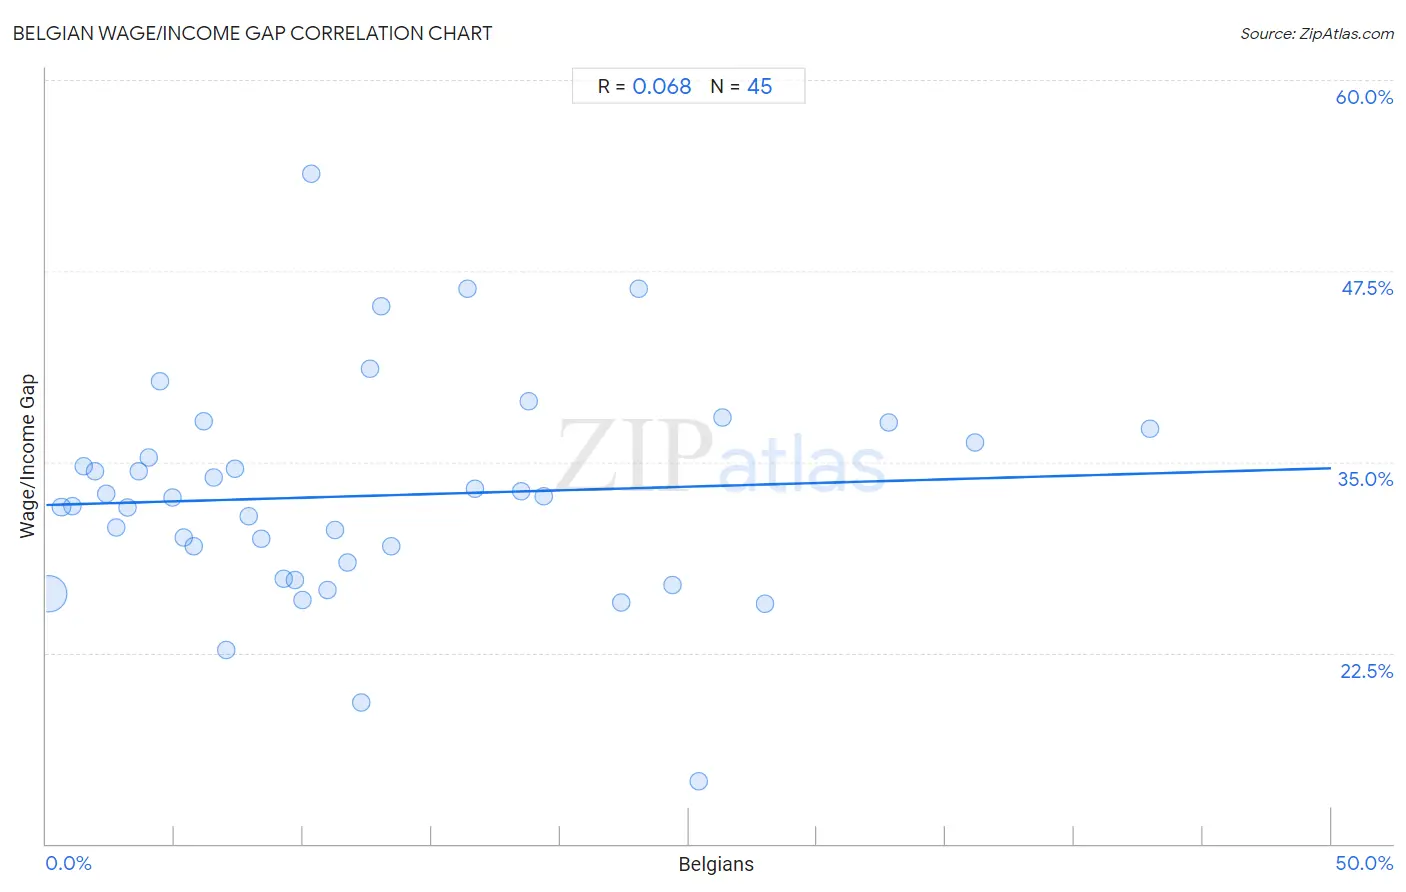
It is essential to understand that the correlation between the percentage of Belgians and wage/income gap percentage does not imply a direct cause-and-effect relationship. It remains uncertain whether the presence of Belgians influences an upward or downward trend in the level of wage/income gap percentage within an area, or if Belgians simply ended up residing in those areas with higher or lower levels of wage/income gap percentage due to other factors.
Demographics Similar to Belgians by Wage/Income Gap
In terms of wage/income gap, the demographic groups most similar to Belgians are Basque (28.8%, a difference of 0.050%), Lithuanian (28.7%, a difference of 0.11%), Maltese (28.7%, a difference of 0.12%), Immigrants from Scotland (28.7%, a difference of 0.17%), and French (28.7%, a difference of 0.32%).
| Demographics | Rating | Rank | Wage/Income Gap |
| Finns | 0.1 /100 | #310 | Tragic 28.6% |
| Immigrants from Lithuania | 0.1 /100 | #311 | Tragic 28.6% |
| Eastern Europeans | 0.1 /100 | #312 | Tragic 28.6% |
| French | 0.1 /100 | #313 | Tragic 28.7% |
| Immigrants from Scotland | 0.1 /100 | #314 | Tragic 28.7% |
| Maltese | 0.1 /100 | #315 | Tragic 28.7% |
| Lithuanians | 0.1 /100 | #316 | Tragic 28.7% |
| Belgians | 0.1 /100 | #317 | Tragic 28.8% |
| Basques | 0.1 /100 | #318 | Tragic 28.8% |
| Slovaks | 0.1 /100 | #319 | Tragic 28.9% |
| British | 0.1 /100 | #320 | Tragic 28.9% |
| Welsh | 0.1 /100 | #321 | Tragic 28.9% |
| Immigrants from Singapore | 0.1 /100 | #322 | Tragic 28.9% |
| Norwegians | 0.1 /100 | #323 | Tragic 29.0% |
| Croatians | 0.0 /100 | #324 | Tragic 29.0% |
Belgian Wage/Income Gap Correlation Summary
| Measurement | Belgian Data | Wage/Income Gap Data |
| Minimum | 0.099% | 14.1% |
| Maximum | 42.9% | 53.8% |
| Range | 42.9% | 39.7% |
| Mean | 12.4% | 32.8% |
| Median | 10.0% | 32.7% |
| Interquartile 25% (IQ1) | 4.7% | 27.9% |
| Interquartile 75% (IQ3) | 18.6% | 36.7% |
| Interquartile Range (IQR) | 13.9% | 8.8% |
| Standard Deviation (Sample) | 10.1% | 7.2% |
| Standard Deviation (Population) | 10.0% | 7.1% |
Correlation Details
| Belgian Percentile | Sample Size | Wage/Income Gap |
[ 0.0% - 0.5% ] 0.099% | 335,207,066 | 26.3% |
[ 0.5% - 1.0% ] 0.58% | 13,583,781 | 32.0% |
[ 1.0% - 1.5% ] 1.03% | 3,499,989 | 32.1% |
[ 1.0% - 1.5% ] 1.46% | 1,105,901 | 34.7% |
[ 1.5% - 2.0% ] 1.88% | 626,180 | 34.4% |
[ 2.0% - 2.5% ] 2.34% | 395,682 | 32.9% |
[ 2.5% - 3.0% ] 2.74% | 281,295 | 30.7% |
[ 3.0% - 3.5% ] 3.17% | 186,841 | 32.0% |
[ 3.5% - 4.0% ] 3.60% | 111,195 | 34.4% |
[ 3.5% - 4.0% ] 3.99% | 57,873 | 35.3% |
[ 4.0% - 4.5% ] 4.44% | 52,100 | 40.3% |
[ 4.5% - 5.0% ] 4.93% | 162,226 | 32.7% |
[ 5.0% - 5.5% ] 5.36% | 76,027 | 30.1% |
[ 5.5% - 6.0% ] 5.72% | 145,840 | 29.5% |
[ 6.0% - 6.5% ] 6.13% | 26,266 | 37.7% |
[ 6.5% - 7.0% ] 6.52% | 43,650 | 34.0% |
[ 7.0% - 7.5% ] 7.01% | 29,040 | 22.7% |
[ 7.0% - 7.5% ] 7.34% | 17,756 | 34.5% |
[ 7.5% - 8.0% ] 7.90% | 9,025 | 31.4% |
[ 8.0% - 8.5% ] 8.35% | 24,655 | 29.9% |
[ 9.0% - 9.5% ] 9.23% | 42,619 | 27.3% |
[ 9.5% - 10.0% ] 9.70% | 17,537 | 27.3% |
[ 9.5% - 10.0% ] 9.96% | 12,103 | 26.0% |
[ 10.0% - 10.5% ] 10.30% | 864 | 53.8% |
[ 10.5% - 11.0% ] 10.93% | 2,561 | 26.6% |
[ 11.0% - 11.5% ] 11.24% | 1,743 | 30.6% |
[ 11.5% - 12.0% ] 11.73% | 486 | 28.4% |
[ 12.0% - 12.5% ] 12.25% | 547 | 19.3% |
[ 12.5% - 13.0% ] 12.59% | 135 | 41.1% |
[ 13.0% - 13.5% ] 13.03% | 1,420 | 45.2% |
[ 13.0% - 13.5% ] 13.45% | 10,881 | 29.5% |
[ 16.0% - 16.5% ] 16.37% | 2,437 | 46.3% |
[ 16.5% - 17.0% ] 16.67% | 5,290 | 33.3% |
[ 18.0% - 18.5% ] 18.46% | 3,244 | 33.1% |
[ 18.5% - 19.0% ] 18.80% | 1,681 | 39.0% |
[ 19.0% - 19.5% ] 19.37% | 790 | 32.8% |
[ 22.0% - 22.5% ] 22.37% | 1,453 | 25.8% |
[ 23.0% - 23.5% ] 23.06% | 4,926 | 46.4% |
[ 24.0% - 24.5% ] 24.39% | 1,464 | 26.9% |
[ 25.0% - 25.5% ] 25.40% | 1,067 | 14.1% |
[ 26.0% - 26.5% ] 26.31% | 7,636 | 37.9% |
[ 27.5% - 28.0% ] 27.96% | 565 | 25.7% |
[ 32.5% - 33.0% ] 32.78% | 598 | 37.6% |
[ 36.0% - 36.5% ] 36.15% | 1,939 | 36.3% |
[ 42.5% - 43.0% ] 42.95% | 2,184 | 37.1% |