Belgian Married-couple Households

COMPARE

Belgian
Race
Ancestry
AfghanAfricanAlaska NativeAlaskan AthabascanAlbanianAleutAlsatianAmericanApacheArabArapahoArgentineanArmenianAssyrian/Chaldean/SyriacAustralianAustrianBahamianBangladeshiBarbadianBasqueBelgianBelizeanBermudanBhutaneseBlackfeetBolivianBrazilianBritishBritish West IndianBulgarianBurmeseCajunCambodianCanadianCape VerdeanCarpatho RusynCelticCentral AmericanCentral American IndianCherokeeCheyenneChickasawChileanChineseChippewaChoctawColombianColvilleComancheCosta RicanCreeCreekCroatianCrowCubanCypriotCzechCzechoslovakianDanishDelawareDominicanDutchDutch West IndianEastern EuropeanEcuadorianEgyptianEnglishEstonianEthiopianEuropeanFijianFilipinoFinnishFrenchFrench American IndianFrench CanadianGermanGerman RussianGhanaianGreekGuamanian/ChamorroGuatemalanGuyaneseHaitianHmongHonduranHopiHoumaHungarianIcelanderIndian (Asian)IndonesianInupiatIranianIraqiIrishIroquoisIsraeliItalianJamaicanJapaneseJordanianKenyanKiowaKoreanLaotianLatvianLebaneseLiberianLithuanianLumbeeLuxembourgerMacedonianMalaysianMalteseMarshalleseMenomineeMexicanMexican American IndianMongolianMoroccanNative HawaiianNavajoNepaleseNew ZealanderNicaraguanNigerianNorthern EuropeanNorwegianOkinawanOsageOttawaPaiutePakistaniPalestinianPanamanianParaguayanPennsylvania GermanPeruvianPimaPolishPortuguesePotawatomiPuebloPuerto RicanPuget Sound SalishRomanianRussianSalvadoranSamoanScandinavianScotch-IrishScottishSeminoleSenegaleseSerbianShoshoneSierra LeoneanSiouxSlavicSlovakSloveneSomaliSouth AfricanSouth AmericanSouth American IndianSoviet UnionSpaniardSpanishSpanish AmericanSpanish American IndianSri LankanSubsaharan AfricanSudaneseSwedishSwissSyrianTaiwaneseThaiTlingit-HaidaTohono O'OdhamTonganTrinidadian and TobagonianTsimshianTurkishU.S. Virgin IslanderUgandanUkrainianUruguayanUteVenezuelanVietnameseWelshWest IndianYakamaYaquiYugoslavianYumanYup'ikZimbabwean
Immigration
NonimmigrantsImmigrantsAfghanistanAfricaAlbaniaArgentinaArmeniaAsiaAustraliaAustriaBahamasBangladeshBarbadosBelarusBelgiumBelizeBoliviaBosnia and HerzegovinaBrazilBulgariaBurma/MyanmarCabo VerdeCambodiaCameroonCanadaCaribbeanCentral AmericaChileChinaColombiaCongoCosta RicaCroatiaCubaCzechoslovakiaDenmarkDominicaDominican RepublicEastern AfricaEastern AsiaEastern EuropeEcuadorEgyptEl SalvadorEnglandEritreaEthiopiaEuropeFijiFranceGermanyGhanaGreeceGrenadaGuatemalaGuyanaHaitiHondurasHong KongHungaryIndiaIndonesiaIranIraqIrelandIsraelItalyJamaicaJapanJordanKazakhstanKenyaKoreaKuwaitLaosLatin AmericaLatviaLebanonLiberiaLithuaniaMalaysiaMexicoMicronesiaMiddle AfricaMoldovaMoroccoNepalNetherlandsNicaraguaNigeriaNorth AmericaNorth MacedoniaNorthern AfricaNorthern EuropeNorwayOceaniaPakistanPanamaPeruPhilippinesPolandPortugalRomaniaRussiaSaudi ArabiaScotlandSenegalSerbiaSierra LeoneSingaporeSomaliaSouth AfricaSouth AmericaSouth Central AsiaSouth Eastern AsiaSouthern EuropeSpainSri LankaSt. Vincent and the GrenadinesSudanSwedenSwitzerlandSyriaTaiwanThailandTrinidad and TobagoTurkeyUgandaUkraineUruguayUzbekistanVenezuelaVietnamWest IndiesWestern AfricaWestern AsiaWestern EuropeYemenZaireZimbabweAzores
Select to Compare
Race
Ancestry
AfghanAfricanAlaska NativeAlaskan AthabascanAlbanianAleutAlsatianAmericanApacheArabArapahoArgentineanArmenianAssyrian/Chaldean/SyriacAustralianAustrianBahamianBangladeshiBarbadianBasqueBelizeanBermudanBhutaneseBlackfeetBolivianBrazilianBritishBritish West IndianBulgarianBurmeseCajunCambodianCanadianCape VerdeanCarpatho RusynCelticCentral AmericanCentral American IndianCherokeeCheyenneChickasawChileanChineseChippewaChoctawColombianColvilleComancheCosta RicanCreeCreekCroatianCrowCubanCypriotCzechCzechoslovakianDanishDelawareDominicanDutchDutch West IndianEastern EuropeanEcuadorianEgyptianEnglishEstonianEthiopianEuropeanFijianFilipinoFinnishFrenchFrench American IndianFrench CanadianGermanGerman RussianGhanaianGreekGuamanian/ChamorroGuatemalanGuyaneseHaitianHmongHonduranHopiHoumaHungarianIcelanderIndian (Asian)IndonesianInupiatIranianIraqiIrishIroquoisIsraeliItalianJamaicanJapaneseJordanianKenyanKiowaKoreanLaotianLatvianLebaneseLiberianLithuanianLumbeeLuxembourgerMacedonianMalaysianMalteseMarshalleseMenomineeMexicanMexican American IndianMongolianMoroccanNative HawaiianNavajoNepaleseNew ZealanderNicaraguanNigerianNorthern EuropeanNorwegianOkinawanOsageOttawaPaiutePakistaniPalestinianPanamanianParaguayanPennsylvania GermanPeruvianPimaPolishPortuguesePotawatomiPuebloPuerto RicanPuget Sound SalishRomanianRussianSalvadoranSamoanScandinavianScotch-IrishScottishSeminoleSenegaleseSerbianShoshoneSierra LeoneanSiouxSlavicSlovakSloveneSomaliSouth AfricanSouth AmericanSouth American IndianSoviet UnionSpaniardSpanishSpanish AmericanSpanish American IndianSri LankanSubsaharan AfricanSudaneseSwedishSwissSyrianTaiwaneseThaiTlingit-HaidaTohono O'OdhamTonganTrinidadian and TobagonianTsimshianTurkishU.S. Virgin IslanderUgandanUkrainianUruguayanUteVenezuelanVietnameseWelshWest IndianYakamaYaquiYugoslavianYumanYup'ikZimbabwean
Immigration
NonimmigrantsImmigrantsAfghanistanAfricaAlbaniaArgentinaArmeniaAsiaAustraliaAustriaBahamasBangladeshBarbadosBelarusBelgiumBelizeBoliviaBosnia and HerzegovinaBrazilBulgariaBurma/MyanmarCabo VerdeCambodiaCameroonCanadaCaribbeanCentral AmericaChileChinaColombiaCongoCosta RicaCroatiaCubaCzechoslovakiaDenmarkDominicaDominican RepublicEastern AfricaEastern AsiaEastern EuropeEcuadorEgyptEl SalvadorEnglandEritreaEthiopiaEuropeFijiFranceGermanyGhanaGreeceGrenadaGuatemalaGuyanaHaitiHondurasHong KongHungaryIndiaIndonesiaIranIraqIrelandIsraelItalyJamaicaJapanJordanKazakhstanKenyaKoreaKuwaitLaosLatin AmericaLatviaLebanonLiberiaLithuaniaMalaysiaMexicoMicronesiaMiddle AfricaMoldovaMoroccoNepalNetherlandsNicaraguaNigeriaNorth AmericaNorth MacedoniaNorthern AfricaNorthern EuropeNorwayOceaniaPakistanPanamaPeruPhilippinesPolandPortugalRomaniaRussiaSaudi ArabiaScotlandSenegalSerbiaSierra LeoneSingaporeSomaliaSouth AfricaSouth AmericaSouth Central AsiaSouth Eastern AsiaSouthern EuropeSpainSri LankaSt. Vincent and the GrenadinesSudanSwedenSwitzerlandSyriaTaiwanThailandTrinidad and TobagoTurkeyUgandaUkraineUruguayUzbekistanVenezuelaVietnamWest IndiesWestern AfricaWestern AsiaWestern EuropeYemenZaireZimbabweAzores
Married-couple Households
Income
Poverty
Unemployment
Labor Participation
Family Structure
Vehicle Availability
Education Level
Disability

Belgian Married-couple Households
Exceptional

48.0%
MARRIED-COUPLE HOUSEHOLDS
97.4/ 100
METRIC RATING
86th/ 347
METRIC RANK

Belgian Married-couple Households Correlation Chart

The statistical analysis conducted on geographies consisting of 355,838,514 people shows a substantial positive correlation between the proportion of Belgians and percentage of married-couple family households in the United States with a correlation coefficient (R) of 0.545 and weighted average of 48.0%. On average, for every 1% (one percent) increase in Belgians within a typical geography, there is an increase of 0.45% in percentage of married-couple family households.
Belgian Married-couple Households
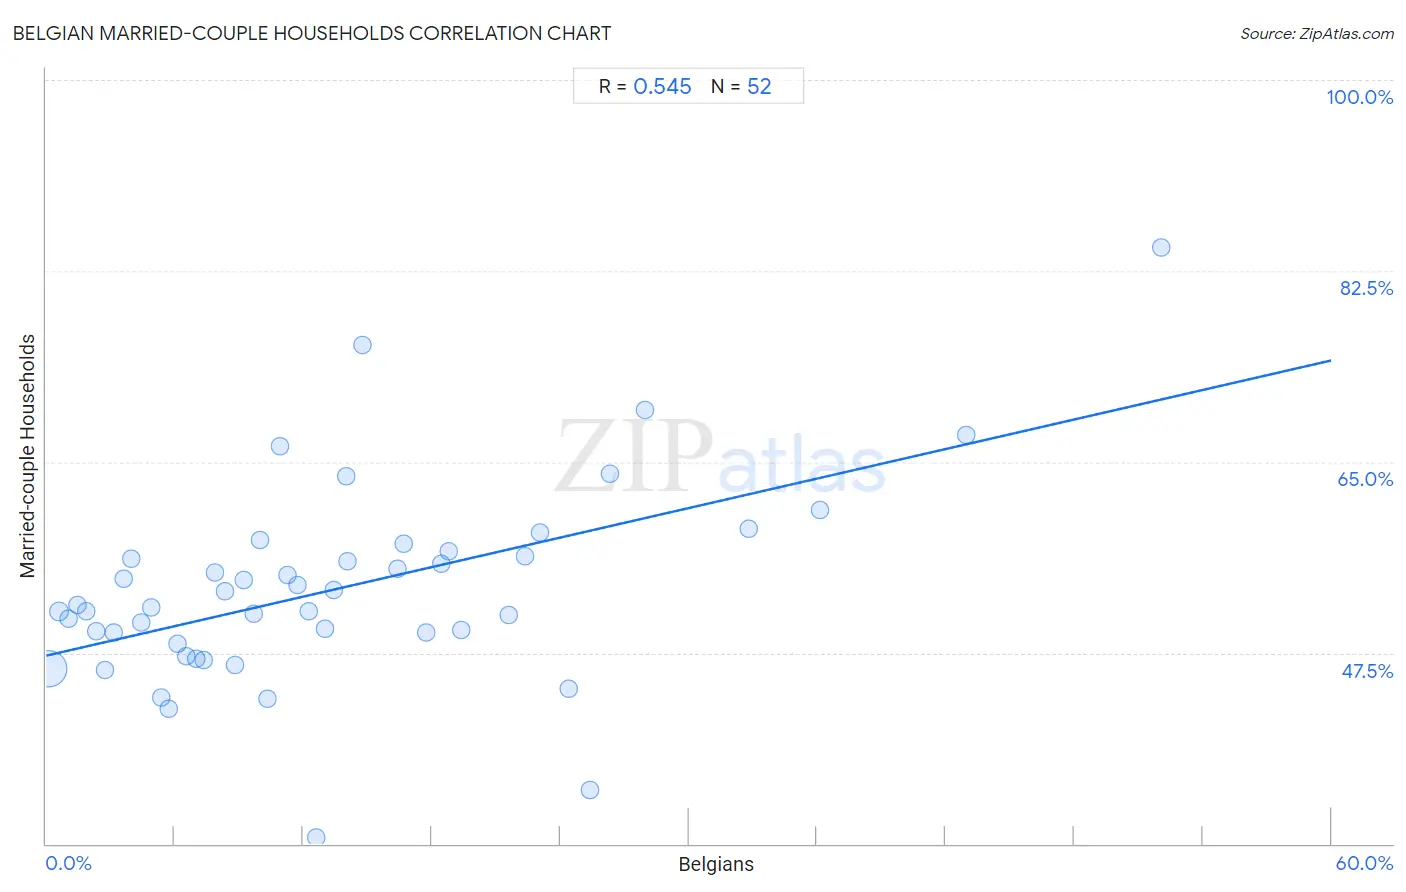
It is essential to understand that the correlation between the percentage of Belgians and percentage of married-couple family households does not imply a direct cause-and-effect relationship. It remains uncertain whether the presence of Belgians influences an upward or downward trend in the level of percentage of married-couple family households within an area, or if Belgians simply ended up residing in those areas with higher or lower levels of percentage of married-couple family households due to other factors.

Demographics Similar to Belgians by Married-couple Households

In terms of married-couple households, the demographic groups most similar to Belgians are Immigrants from Ireland (48.0%, a difference of 0.010%), Afghan (48.0%, a difference of 0.020%), Immigrants from Israel (48.0%, a difference of 0.030%), Cypriot (48.0%, a difference of 0.050%), and French (48.0%, a difference of 0.060%).
DemographicsRating | RankMarried-couple Households
Immigrants from Netherlands
98.2
/100
|
#79
Exceptional
48.2%
Russians
98.1
/100
|
#80
Exceptional
48.2%
Finns
98.0
/100
|
#81
Exceptional
48.1%
Immigrants from Poland
97.7
/100
|
#82
Exceptional
48.1%
Guamanians/Chamorros
97.6
/100
|
#83
Exceptional
48.1%
Ukrainians
97.6
/100
|
#84
Exceptional
48.1%
Immigrants from Israel
97.4
/100
|
#85
Exceptional
48.0%
Belgians
97.4
/100
|
#86
Exceptional
48.0%
Immigrants from Ireland
97.3
/100
|
#87
Exceptional
48.0%
Afghans
97.3
/100
|
#88
Exceptional
48.0%
Cypriots
97.2
/100
|
#89
Exceptional
48.0%
French
97.2
/100
|
#90
Exceptional
48.0%
Immigrants from Moldova
97.0
/100
|
#91
Exceptional
48.0%
Palestinians
96.9
/100
|
#92
Exceptional
48.0%
Lebanese
96.9
/100
|
#93
Exceptional
47.9%

Belgian Married-couple Households Correlation Summary

MeasurementBelgian DataMarried-couple Households Data
Minimum0.099%30.6%
Maximum52.1%84.6%
Range52.0%54.0%
Mean13.5%53.3%
Median11.1%51.8%
Interquartile 25% (IQ1)5.5%48.8%
Interquartile 75% (IQ3)18.6%56.6%
Interquartile Range (IQR)13.1%7.8%
Standard Deviation (Sample)11.0%9.1%
Standard Deviation (Population)10.9%9.0%

Correlation Details

Belgian PercentileSample SizeMarried-couple Households
[
0.0%
-
0.5%
]
0.099%
335,141,34046.1%
[
0.5%
-
1.0%
]
0.58%
13,624,16751.3%
[
1.0%
-
1.5%
]
1.03%
3,526,99750.7%
[
1.0%
-
1.5%
]
1.46%
1,114,93951.9%
[
1.5%
-
2.0%
]
1.88%
633,63551.3%
[
2.0%
-
2.5%
]
2.34%
401,47249.4%
[
2.5%
-
3.0%
]
2.74%
292,23545.9%
[
3.0%
-
3.5%
]
3.17%
190,34149.3%
[
3.5%
-
4.0%
]
3.60%
116,59954.2%
[
3.5%
-
4.0%
]
3.99%
60,17656.1%
[
4.0%
-
4.5%
]
4.43%
58,34250.3%
[
4.5%
-
5.0%
]
4.93%
164,20051.7%
[
5.0%
-
5.5%
]
5.35%
77,90243.4%
[
5.5%
-
6.0%
]
5.72%
147,77942.4%
[
6.0%
-
6.5%
]
6.13%
27,01748.3%
[
6.5%
-
7.0%
]
6.52%
46,16147.2%
[
7.0%
-
7.5%
]
7.01%
29,84047.0%
[
7.0%
-
7.5%
]
7.34%
18,98046.8%
[
7.5%
-
8.0%
]
7.88%
10,46854.8%
[
8.0%
-
8.5%
]
8.35%
25,58353.1%
[
8.5%
-
9.0%
]
8.82%
57846.4%
[
9.0%
-
9.5%
]
9.23%
42,76054.1%
[
9.5%
-
10.0%
]
9.69%
18,18751.1%
[
9.5%
-
10.0%
]
9.96%
12,10357.9%
[
10.0%
-
10.5%
]
10.30%
1,37843.3%
[
10.5%
-
11.0%
]
10.94%
3,01766.5%
[
11.0%
-
11.5%
]
11.24%
1,75254.6%
[
11.5%
-
12.0%
]
11.71%
87153.7%
[
12.0%
-
12.5%
]
12.25%
54751.3%
[
12.5%
-
13.0%
]
12.59%
13530.6%
[
13.0%
-
13.5%
]
13.03%
1,42049.7%
[
13.0%
-
13.5%
]
13.45%
11,15353.2%
[
14.0%
-
14.5%
]
14.04%
5763.6%
[
14.0%
-
14.5%
]
14.06%
12855.9%
[
14.5%
-
15.0%
]
14.76%
48175.8%
[
16.0%
-
16.5%
]
16.37%
2,43755.2%
[
16.5%
-
17.0%
]
16.67%
5,29057.5%
[
17.5%
-
18.0%
]
17.72%
23749.3%
[
18.0%
-
18.5%
]
18.46%
3,24455.7%
[
18.5%
-
19.0%
]
18.80%
1,68156.8%
[
19.0%
-
19.5%
]
19.37%
79049.6%
[
21.5%
-
22.0%
]
21.58%
19051.0%
[
22.0%
-
22.5%
]
22.37%
1,45356.3%
[
23.0%
-
23.5%
]
23.06%
4,92658.5%
[
24.0%
-
24.5%
]
24.39%
1,46444.3%
[
25.0%
-
25.5%
]
25.40%
1,06734.9%
[
26.0%
-
26.5%
]
26.31%
7,63663.9%
[
27.5%
-
28.0%
]
27.96%
56569.8%
[
32.5%
-
33.0%
]
32.78%
59858.9%
[
36.0%
-
36.5%
]
36.15%
1,93960.6%
[
42.5%
-
43.0%
]
42.95%
2,18467.5%
[
52.0%
-
52.5%
]
52.05%
7384.6%