Belgian 2 or more Vehicles in Household

COMPARE

Belgian
Race
Ancestry
AfghanAfricanAlaska NativeAlaskan AthabascanAlbanianAleutAlsatianAmericanApacheArabArapahoArgentineanArmenianAssyrian/Chaldean/SyriacAustralianAustrianBahamianBangladeshiBarbadianBasqueBelgianBelizeanBermudanBhutaneseBlackfeetBolivianBrazilianBritishBritish West IndianBulgarianBurmeseCajunCambodianCanadianCape VerdeanCarpatho RusynCelticCentral AmericanCentral American IndianCherokeeCheyenneChickasawChileanChineseChippewaChoctawColombianColvilleComancheCosta RicanCreeCreekCroatianCrowCubanCypriotCzechCzechoslovakianDanishDelawareDominicanDutchDutch West IndianEastern EuropeanEcuadorianEgyptianEnglishEstonianEthiopianEuropeanFijianFilipinoFinnishFrenchFrench American IndianFrench CanadianGermanGerman RussianGhanaianGreekGuamanian/ChamorroGuatemalanGuyaneseHaitianHmongHonduranHopiHoumaHungarianIcelanderIndian (Asian)IndonesianInupiatIranianIraqiIrishIroquoisIsraeliItalianJamaicanJapaneseJordanianKenyanKiowaKoreanLaotianLatvianLebaneseLiberianLithuanianLumbeeLuxembourgerMacedonianMalaysianMalteseMarshalleseMenomineeMexicanMexican American IndianMongolianMoroccanNative HawaiianNavajoNepaleseNew ZealanderNicaraguanNigerianNorthern EuropeanNorwegianOkinawanOsageOttawaPaiutePakistaniPalestinianPanamanianParaguayanPennsylvania GermanPeruvianPimaPolishPortuguesePotawatomiPuebloPuerto RicanPuget Sound SalishRomanianRussianSalvadoranSamoanScandinavianScotch-IrishScottishSeminoleSenegaleseSerbianShoshoneSierra LeoneanSiouxSlavicSlovakSloveneSomaliSouth AfricanSouth AmericanSouth American IndianSoviet UnionSpaniardSpanishSpanish AmericanSpanish American IndianSri LankanSubsaharan AfricanSudaneseSwedishSwissSyrianTaiwaneseThaiTlingit-HaidaTohono O'OdhamTonganTrinidadian and TobagonianTsimshianTurkishU.S. Virgin IslanderUgandanUkrainianUruguayanUteVenezuelanVietnameseWelshWest IndianYakamaYaquiYugoslavianYumanYup'ikZimbabwean
Immigration
NonimmigrantsImmigrantsAfghanistanAfricaAlbaniaArgentinaArmeniaAsiaAustraliaAustriaBahamasBangladeshBarbadosBelarusBelgiumBelizeBoliviaBosnia and HerzegovinaBrazilBulgariaBurma/MyanmarCabo VerdeCambodiaCameroonCanadaCaribbeanCentral AmericaChileChinaColombiaCongoCosta RicaCroatiaCubaCzechoslovakiaDenmarkDominicaDominican RepublicEastern AfricaEastern AsiaEastern EuropeEcuadorEgyptEl SalvadorEnglandEritreaEthiopiaEuropeFijiFranceGermanyGhanaGreeceGrenadaGuatemalaGuyanaHaitiHondurasHong KongHungaryIndiaIndonesiaIranIraqIrelandIsraelItalyJamaicaJapanJordanKazakhstanKenyaKoreaKuwaitLaosLatin AmericaLatviaLebanonLiberiaLithuaniaMalaysiaMexicoMicronesiaMiddle AfricaMoldovaMoroccoNepalNetherlandsNicaraguaNigeriaNorth AmericaNorth MacedoniaNorthern AfricaNorthern EuropeNorwayOceaniaPakistanPanamaPeruPhilippinesPolandPortugalRomaniaRussiaSaudi ArabiaScotlandSenegalSerbiaSierra LeoneSingaporeSomaliaSouth AfricaSouth AmericaSouth Central AsiaSouth Eastern AsiaSouthern EuropeSpainSri LankaSt. Vincent and the GrenadinesSudanSwedenSwitzerlandSyriaTaiwanThailandTrinidad and TobagoTurkeyUgandaUkraineUruguayUzbekistanVenezuelaVietnamWest IndiesWestern AfricaWestern AsiaWestern EuropeYemenZaireZimbabweAzores
Select to Compare
Race
Ancestry
AfghanAfricanAlaska NativeAlaskan AthabascanAlbanianAleutAlsatianAmericanApacheArabArapahoArgentineanArmenianAssyrian/Chaldean/SyriacAustralianAustrianBahamianBangladeshiBarbadianBasqueBelizeanBermudanBhutaneseBlackfeetBolivianBrazilianBritishBritish West IndianBulgarianBurmeseCajunCambodianCanadianCape VerdeanCarpatho RusynCelticCentral AmericanCentral American IndianCherokeeCheyenneChickasawChileanChineseChippewaChoctawColombianColvilleComancheCosta RicanCreeCreekCroatianCrowCubanCypriotCzechCzechoslovakianDanishDelawareDominicanDutchDutch West IndianEastern EuropeanEcuadorianEgyptianEnglishEstonianEthiopianEuropeanFijianFilipinoFinnishFrenchFrench American IndianFrench CanadianGermanGerman RussianGhanaianGreekGuamanian/ChamorroGuatemalanGuyaneseHaitianHmongHonduranHopiHoumaHungarianIcelanderIndian (Asian)IndonesianInupiatIranianIraqiIrishIroquoisIsraeliItalianJamaicanJapaneseJordanianKenyanKiowaKoreanLaotianLatvianLebaneseLiberianLithuanianLumbeeLuxembourgerMacedonianMalaysianMalteseMarshalleseMenomineeMexicanMexican American IndianMongolianMoroccanNative HawaiianNavajoNepaleseNew ZealanderNicaraguanNigerianNorthern EuropeanNorwegianOkinawanOsageOttawaPaiutePakistaniPalestinianPanamanianParaguayanPennsylvania GermanPeruvianPimaPolishPortuguesePotawatomiPuebloPuerto RicanPuget Sound SalishRomanianRussianSalvadoranSamoanScandinavianScotch-IrishScottishSeminoleSenegaleseSerbianShoshoneSierra LeoneanSiouxSlavicSlovakSloveneSomaliSouth AfricanSouth AmericanSouth American IndianSoviet UnionSpaniardSpanishSpanish AmericanSpanish American IndianSri LankanSubsaharan AfricanSudaneseSwedishSwissSyrianTaiwaneseThaiTlingit-HaidaTohono O'OdhamTonganTrinidadian and TobagonianTsimshianTurkishU.S. Virgin IslanderUgandanUkrainianUruguayanUteVenezuelanVietnameseWelshWest IndianYakamaYaquiYugoslavianYumanYup'ikZimbabwean
Immigration
NonimmigrantsImmigrantsAfghanistanAfricaAlbaniaArgentinaArmeniaAsiaAustraliaAustriaBahamasBangladeshBarbadosBelarusBelgiumBelizeBoliviaBosnia and HerzegovinaBrazilBulgariaBurma/MyanmarCabo VerdeCambodiaCameroonCanadaCaribbeanCentral AmericaChileChinaColombiaCongoCosta RicaCroatiaCubaCzechoslovakiaDenmarkDominicaDominican RepublicEastern AfricaEastern AsiaEastern EuropeEcuadorEgyptEl SalvadorEnglandEritreaEthiopiaEuropeFijiFranceGermanyGhanaGreeceGrenadaGuatemalaGuyanaHaitiHondurasHong KongHungaryIndiaIndonesiaIranIraqIrelandIsraelItalyJamaicaJapanJordanKazakhstanKenyaKoreaKuwaitLaosLatin AmericaLatviaLebanonLiberiaLithuaniaMalaysiaMexicoMicronesiaMiddle AfricaMoldovaMoroccoNepalNetherlandsNicaraguaNigeriaNorth AmericaNorth MacedoniaNorthern AfricaNorthern EuropeNorwayOceaniaPakistanPanamaPeruPhilippinesPolandPortugalRomaniaRussiaSaudi ArabiaScotlandSenegalSerbiaSierra LeoneSingaporeSomaliaSouth AfricaSouth AmericaSouth Central AsiaSouth Eastern AsiaSouthern EuropeSpainSri LankaSt. Vincent and the GrenadinesSudanSwedenSwitzerlandSyriaTaiwanThailandTrinidad and TobagoTurkeyUgandaUkraineUruguayUzbekistanVenezuelaVietnamWest IndiesWestern AfricaWestern AsiaWestern EuropeYemenZaireZimbabweAzores
2 or more Vehicles in Household
Income
Poverty
Unemployment
Labor Participation
Family Structure
Vehicle Availability
Education Level
Disability

Belgian 2 or more Vehicles in Household
Exceptional

59.3%
2+ VEHICLES AVAILABLE
99.9/ 100
METRIC RATING
49th/ 347
METRIC RANK

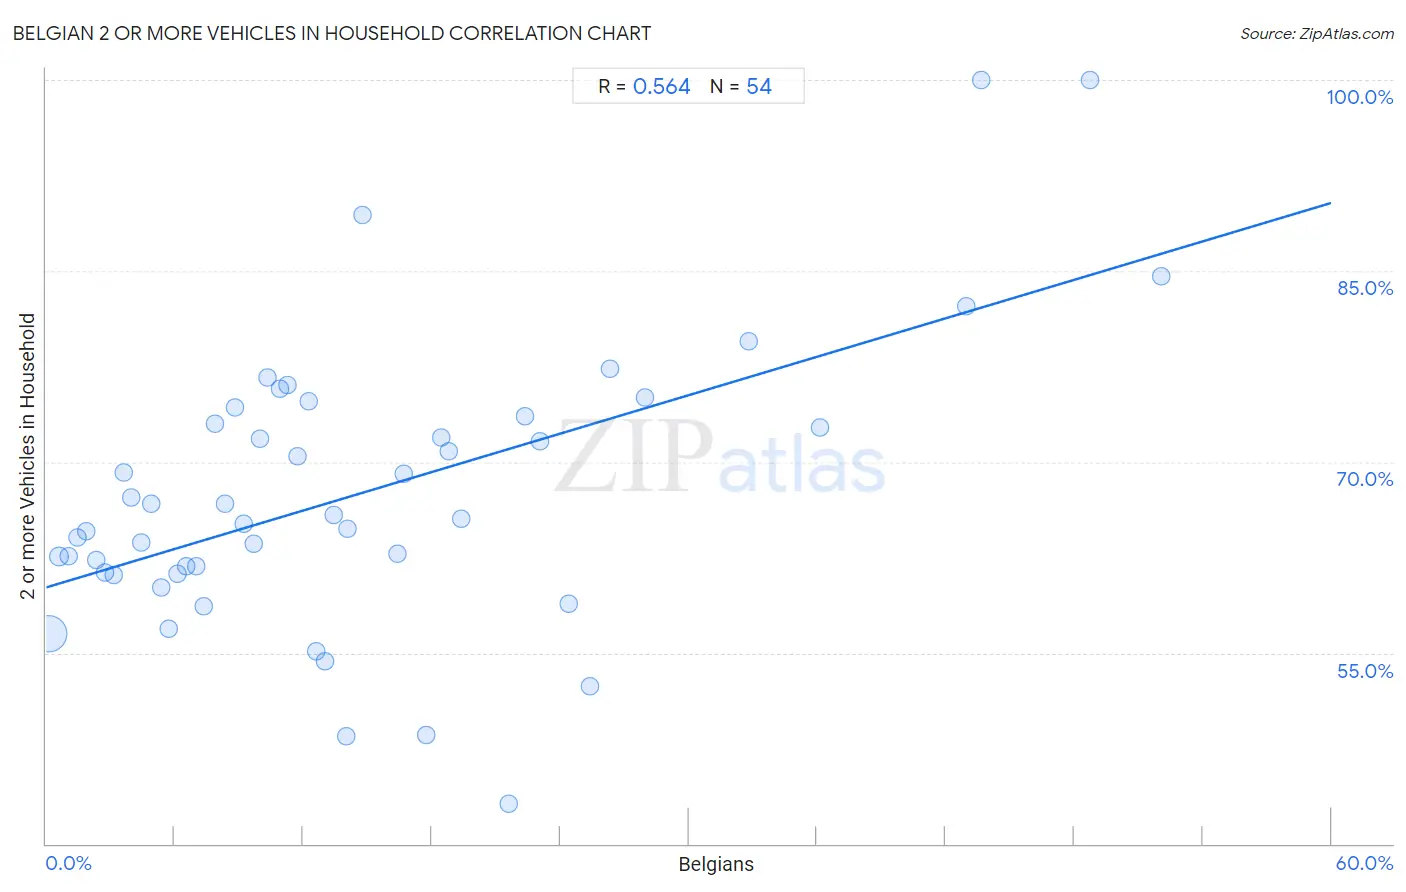
Belgian 2 or more Vehicles in Household Correlation Chart

The statistical analysis conducted on geographies consisting of 355,869,079 people shows a substantial positive correlation between the proportion of Belgians and percentage of households with 2 or more vehicles available in the United States with a correlation coefficient (R) of 0.564 and weighted average of 59.3%. On average, for every 1% (one percent) increase in Belgians within a typical geography, there is an increase of 0.50% in percentage of households with 2 or more vehicles available.
Belgian 2 or more Vehicles in Household
It is essential to understand that the correlation between the percentage of Belgians and percentage of households with 2 or more vehicles available does not imply a direct cause-and-effect relationship. It remains uncertain whether the presence of Belgians influences an upward or downward trend in the level of percentage of households with 2 or more vehicles available within an area, or if Belgians simply ended up residing in those areas with higher or lower levels of percentage of households with 2 or more vehicles available due to other factors.

Demographics Similar to Belgians by 2 or more Vehicles in Household

In terms of 2 or more vehicles in household, the demographic groups most similar to Belgians are Choctaw (59.3%, a difference of 0.010%), Immigrants from India (59.3%, a difference of 0.040%), Yaqui (59.3%, a difference of 0.060%), Spaniard (59.2%, a difference of 0.15%), and Immigrants from Laos (59.2%, a difference of 0.15%).
DemographicsRating | Rank2 or more Vehicles in Household
Malaysians
100.0
/100
|
#42
Exceptional
59.8%
Czechoslovakians
100.0
/100
|
#43
Exceptional
59.8%
French
100.0
/100
|
#44
Exceptional
59.8%
Immigrants from Taiwan
100.0
/100
|
#45
Exceptional
59.7%
Immigrants from South Eastern Asia
100.0
/100
|
#46
Exceptional
59.6%
Yaqui
99.9
/100
|
#47
Exceptional
59.3%
Immigrants from India
99.9
/100
|
#48
Exceptional
59.3%
Belgians
99.9
/100
|
#49
Exceptional
59.3%
Choctaw
99.9
/100
|
#50
Exceptional
59.3%
Spaniards
99.9
/100
|
#51
Exceptional
59.2%
Immigrants from Laos
99.9
/100
|
#52
Exceptional
59.2%
Celtics
99.9
/100
|
#53
Exceptional
59.2%
Bhutanese
99.9
/100
|
#54
Exceptional
59.1%
Luxembourgers
99.9
/100
|
#55
Exceptional
59.1%
Chickasaw
99.9
/100
|
#56
Exceptional
59.0%

Belgian 2 or more Vehicles in Household Correlation Summary

MeasurementBelgian Data2 or more Vehicles in Household Data
Minimum0.099%43.1%
Maximum52.1%100.0%
Range52.0%56.9%
Mean14.7%67.6%
Median11.5%65.7%
Interquartile 25% (IQ1)5.7%61.3%
Interquartile 75% (IQ3)19.4%73.6%
Interquartile Range (IQR)13.6%12.3%
Standard Deviation (Sample)12.5%11.1%
Standard Deviation (Population)12.4%11.0%

Correlation Details

Belgian PercentileSample Size2 or more Vehicles in Household
[
0.0%
-
0.5%
]
0.099%
335,154,71256.5%
[
0.5%
-
1.0%
]
0.58%
13,640,61062.6%
[
1.0%
-
1.5%
]
1.03%
3,526,99762.6%
[
1.0%
-
1.5%
]
1.46%
1,114,93964.1%
[
1.5%
-
2.0%
]
1.88%
633,63564.5%
[
2.0%
-
2.5%
]
2.34%
401,47262.3%
[
2.5%
-
3.0%
]
2.74%
292,23561.3%
[
3.0%
-
3.5%
]
3.17%
190,34161.1%
[
3.5%
-
4.0%
]
3.60%
116,59969.2%
[
3.5%
-
4.0%
]
3.99%
60,17667.2%
[
4.0%
-
4.5%
]
4.43%
58,34263.7%
[
4.5%
-
5.0%
]
4.93%
164,20066.7%
[
5.0%
-
5.5%
]
5.35%
77,90260.1%
[
5.5%
-
6.0%
]
5.72%
148,10356.9%
[
6.0%
-
6.5%
]
6.13%
27,01761.3%
[
6.5%
-
7.0%
]
6.52%
46,38361.8%
[
7.0%
-
7.5%
]
7.01%
29,84061.8%
[
7.0%
-
7.5%
]
7.34%
18,98058.6%
[
7.5%
-
8.0%
]
7.88%
10,46873.0%
[
8.0%
-
8.5%
]
8.35%
25,58366.7%
[
8.5%
-
9.0%
]
8.82%
57874.3%
[
9.0%
-
9.5%
]
9.23%
42,76065.1%
[
9.5%
-
10.0%
]
9.69%
18,18763.6%
[
9.5%
-
10.0%
]
9.96%
12,10371.8%
[
10.0%
-
10.5%
]
10.30%
1,37876.7%
[
10.5%
-
11.0%
]
10.94%
3,01775.8%
[
11.0%
-
11.5%
]
11.24%
1,75276.0%
[
11.5%
-
12.0%
]
11.71%
87170.4%
[
12.0%
-
12.5%
]
12.25%
54774.8%
[
12.5%
-
13.0%
]
12.59%
13555.1%
[
13.0%
-
13.5%
]
13.03%
1,42054.4%
[
13.0%
-
13.5%
]
13.45%
11,15365.8%
[
14.0%
-
14.5%
]
14.04%
5748.5%
[
14.0%
-
14.5%
]
14.06%
12864.7%
[
14.5%
-
15.0%
]
14.76%
48189.4%
[
16.0%
-
16.5%
]
16.37%
2,43762.8%
[
16.5%
-
17.0%
]
16.67%
5,29069.1%
[
17.5%
-
18.0%
]
17.72%
23748.6%
[
18.0%
-
18.5%
]
18.46%
3,24471.9%
[
18.5%
-
19.0%
]
18.80%
1,68170.8%
[
19.0%
-
19.5%
]
19.37%
79065.6%
[
21.5%
-
22.0%
]
21.58%
19043.1%
[
22.0%
-
22.5%
]
22.37%
1,45373.6%
[
23.0%
-
23.5%
]
23.06%
4,92671.6%
[
24.0%
-
24.5%
]
24.39%
1,46458.9%
[
25.0%
-
25.5%
]
25.40%
1,06752.4%
[
26.0%
-
26.5%
]
26.31%
7,63677.3%
[
27.5%
-
28.0%
]
27.96%
56575.0%
[
32.5%
-
33.0%
]
32.78%
59879.5%
[
36.0%
-
36.5%
]
36.15%
1,93972.7%
[
42.5%
-
43.0%
]
42.95%
2,18482.2%
[
43.5%
-
44.0%
]
43.65%
126100.0%
[
48.5%
-
49.0%
]
48.72%
78100.0%
[
52.0%
-
52.5%
]
52.05%
7384.6%