Belgian Self-Care Disability

COMPARE

Belgian
Race
Ancestry
AfghanAfricanAlaska NativeAlaskan AthabascanAlbanianAleutAlsatianAmericanApacheArabArapahoArgentineanArmenianAssyrian/Chaldean/SyriacAustralianAustrianBahamianBangladeshiBarbadianBasqueBelgianBelizeanBermudanBhutaneseBlackfeetBolivianBrazilianBritishBritish West IndianBulgarianBurmeseCajunCambodianCanadianCape VerdeanCarpatho RusynCelticCentral AmericanCentral American IndianCherokeeCheyenneChickasawChileanChineseChippewaChoctawColombianColvilleComancheCosta RicanCreeCreekCroatianCrowCubanCypriotCzechCzechoslovakianDanishDelawareDominicanDutchDutch West IndianEastern EuropeanEcuadorianEgyptianEnglishEstonianEthiopianEuropeanFijianFilipinoFinnishFrenchFrench American IndianFrench CanadianGermanGerman RussianGhanaianGreekGuamanian/ChamorroGuatemalanGuyaneseHaitianHmongHonduranHopiHoumaHungarianIcelanderIndian (Asian)IndonesianInupiatIranianIraqiIrishIroquoisIsraeliItalianJamaicanJapaneseJordanianKenyanKiowaKoreanLaotianLatvianLebaneseLiberianLithuanianLumbeeLuxembourgerMacedonianMalaysianMalteseMarshalleseMenomineeMexicanMexican American IndianMongolianMoroccanNative HawaiianNavajoNepaleseNew ZealanderNicaraguanNigerianNorthern EuropeanNorwegianOkinawanOsageOttawaPaiutePakistaniPalestinianPanamanianParaguayanPennsylvania GermanPeruvianPimaPolishPortuguesePotawatomiPuebloPuerto RicanPuget Sound SalishRomanianRussianSalvadoranSamoanScandinavianScotch-IrishScottishSeminoleSenegaleseSerbianShoshoneSierra LeoneanSiouxSlavicSlovakSloveneSomaliSouth AfricanSouth AmericanSouth American IndianSoviet UnionSpaniardSpanishSpanish AmericanSpanish American IndianSri LankanSubsaharan AfricanSudaneseSwedishSwissSyrianTaiwaneseThaiTlingit-HaidaTohono O'OdhamTonganTrinidadian and TobagonianTsimshianTurkishU.S. Virgin IslanderUgandanUkrainianUruguayanUteVenezuelanVietnameseWelshWest IndianYakamaYaquiYugoslavianYumanYup'ikZimbabwean
Immigration
NonimmigrantsImmigrantsAfghanistanAfricaAlbaniaArgentinaArmeniaAsiaAustraliaAustriaBahamasBangladeshBarbadosBelarusBelgiumBelizeBoliviaBosnia and HerzegovinaBrazilBulgariaBurma/MyanmarCabo VerdeCambodiaCameroonCanadaCaribbeanCentral AmericaChileChinaColombiaCongoCosta RicaCroatiaCubaCzechoslovakiaDenmarkDominicaDominican RepublicEastern AfricaEastern AsiaEastern EuropeEcuadorEgyptEl SalvadorEnglandEritreaEthiopiaEuropeFijiFranceGermanyGhanaGreeceGrenadaGuatemalaGuyanaHaitiHondurasHong KongHungaryIndiaIndonesiaIranIraqIrelandIsraelItalyJamaicaJapanJordanKazakhstanKenyaKoreaKuwaitLaosLatin AmericaLatviaLebanonLiberiaLithuaniaMalaysiaMexicoMicronesiaMiddle AfricaMoldovaMoroccoNepalNetherlandsNicaraguaNigeriaNorth AmericaNorth MacedoniaNorthern AfricaNorthern EuropeNorwayOceaniaPakistanPanamaPeruPhilippinesPolandPortugalRomaniaRussiaSaudi ArabiaScotlandSenegalSerbiaSierra LeoneSingaporeSomaliaSouth AfricaSouth AmericaSouth Central AsiaSouth Eastern AsiaSouthern EuropeSpainSri LankaSt. Vincent and the GrenadinesSudanSwedenSwitzerlandSyriaTaiwanThailandTrinidad and TobagoTurkeyUgandaUkraineUruguayUzbekistanVenezuelaVietnamWest IndiesWestern AfricaWestern AsiaWestern EuropeYemenZaireZimbabweAzores
Select to Compare
Race
Ancestry
AfghanAfricanAlaska NativeAlaskan AthabascanAlbanianAleutAlsatianAmericanApacheArabArapahoArgentineanArmenianAssyrian/Chaldean/SyriacAustralianAustrianBahamianBangladeshiBarbadianBasqueBelizeanBermudanBhutaneseBlackfeetBolivianBrazilianBritishBritish West IndianBulgarianBurmeseCajunCambodianCanadianCape VerdeanCarpatho RusynCelticCentral AmericanCentral American IndianCherokeeCheyenneChickasawChileanChineseChippewaChoctawColombianColvilleComancheCosta RicanCreeCreekCroatianCrowCubanCypriotCzechCzechoslovakianDanishDelawareDominicanDutchDutch West IndianEastern EuropeanEcuadorianEgyptianEnglishEstonianEthiopianEuropeanFijianFilipinoFinnishFrenchFrench American IndianFrench CanadianGermanGerman RussianGhanaianGreekGuamanian/ChamorroGuatemalanGuyaneseHaitianHmongHonduranHopiHoumaHungarianIcelanderIndian (Asian)IndonesianInupiatIranianIraqiIrishIroquoisIsraeliItalianJamaicanJapaneseJordanianKenyanKiowaKoreanLaotianLatvianLebaneseLiberianLithuanianLumbeeLuxembourgerMacedonianMalaysianMalteseMarshalleseMenomineeMexicanMexican American IndianMongolianMoroccanNative HawaiianNavajoNepaleseNew ZealanderNicaraguanNigerianNorthern EuropeanNorwegianOkinawanOsageOttawaPaiutePakistaniPalestinianPanamanianParaguayanPennsylvania GermanPeruvianPimaPolishPortuguesePotawatomiPuebloPuerto RicanPuget Sound SalishRomanianRussianSalvadoranSamoanScandinavianScotch-IrishScottishSeminoleSenegaleseSerbianShoshoneSierra LeoneanSiouxSlavicSlovakSloveneSomaliSouth AfricanSouth AmericanSouth American IndianSoviet UnionSpaniardSpanishSpanish AmericanSpanish American IndianSri LankanSubsaharan AfricanSudaneseSwedishSwissSyrianTaiwaneseThaiTlingit-HaidaTohono O'OdhamTonganTrinidadian and TobagonianTsimshianTurkishU.S. Virgin IslanderUgandanUkrainianUruguayanUteVenezuelanVietnameseWelshWest IndianYakamaYaquiYugoslavianYumanYup'ikZimbabwean
Immigration
NonimmigrantsImmigrantsAfghanistanAfricaAlbaniaArgentinaArmeniaAsiaAustraliaAustriaBahamasBangladeshBarbadosBelarusBelgiumBelizeBoliviaBosnia and HerzegovinaBrazilBulgariaBurma/MyanmarCabo VerdeCambodiaCameroonCanadaCaribbeanCentral AmericaChileChinaColombiaCongoCosta RicaCroatiaCubaCzechoslovakiaDenmarkDominicaDominican RepublicEastern AfricaEastern AsiaEastern EuropeEcuadorEgyptEl SalvadorEnglandEritreaEthiopiaEuropeFijiFranceGermanyGhanaGreeceGrenadaGuatemalaGuyanaHaitiHondurasHong KongHungaryIndiaIndonesiaIranIraqIrelandIsraelItalyJamaicaJapanJordanKazakhstanKenyaKoreaKuwaitLaosLatin AmericaLatviaLebanonLiberiaLithuaniaMalaysiaMexicoMicronesiaMiddle AfricaMoldovaMoroccoNepalNetherlandsNicaraguaNigeriaNorth AmericaNorth MacedoniaNorthern AfricaNorthern EuropeNorwayOceaniaPakistanPanamaPeruPhilippinesPolandPortugalRomaniaRussiaSaudi ArabiaScotlandSenegalSerbiaSierra LeoneSingaporeSomaliaSouth AfricaSouth AmericaSouth Central AsiaSouth Eastern AsiaSouthern EuropeSpainSri LankaSt. Vincent and the GrenadinesSudanSwedenSwitzerlandSyriaTaiwanThailandTrinidad and TobagoTurkeyUgandaUkraineUruguayUzbekistanVenezuelaVietnamWest IndiesWestern AfricaWestern AsiaWestern EuropeYemenZaireZimbabweAzores
Self-Care Disability
Income
Poverty
Unemployment
Labor Participation
Family Structure
Vehicle Availability
Education Level
Disability

Belgian Self-Care Disability
Exceptional

2.4%
SELF-CARE DISABILITY
90.9/ 100
METRIC RATING
122nd/ 347
METRIC RANK

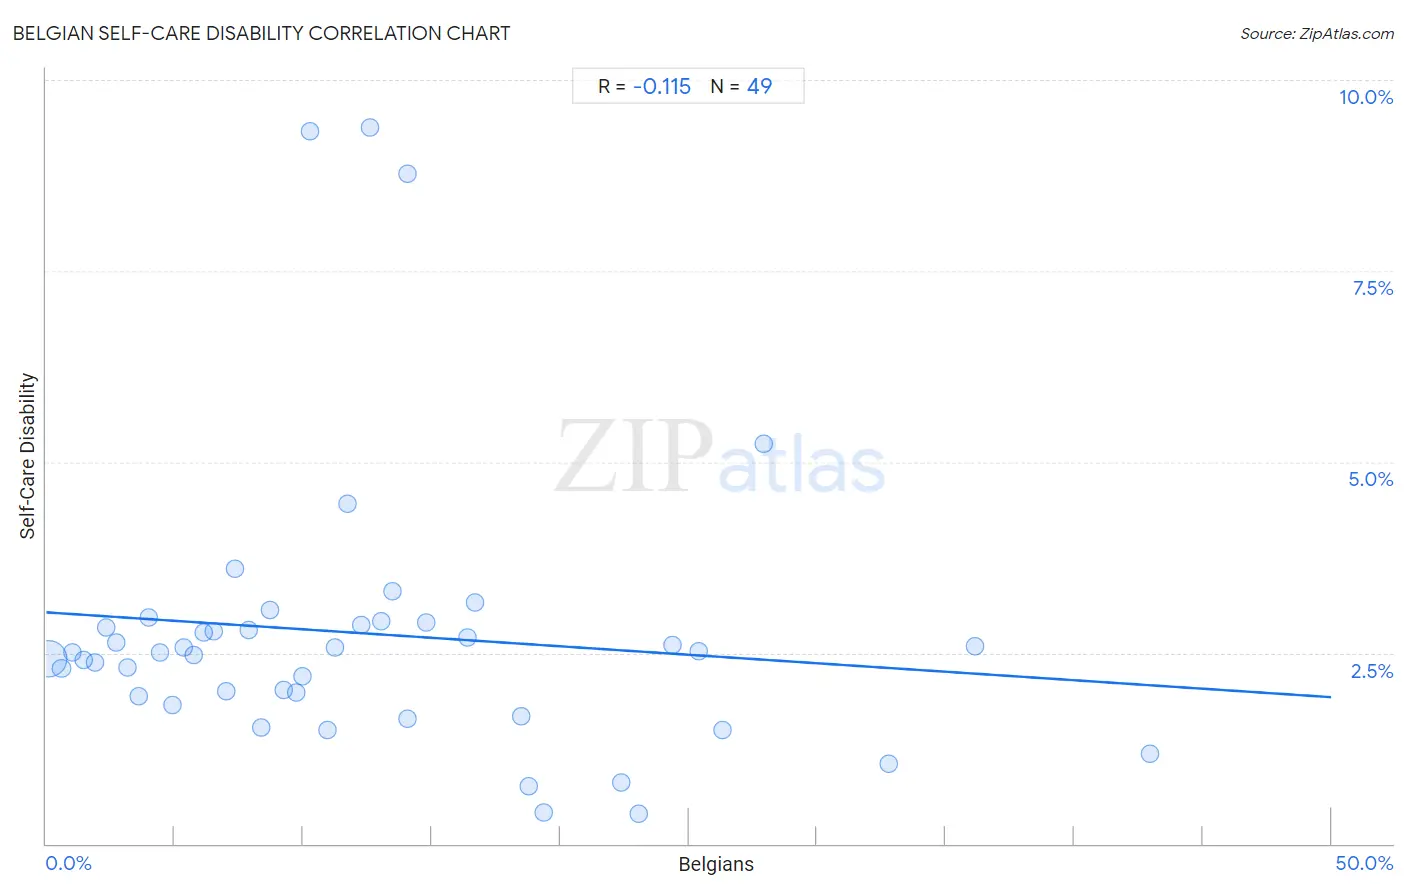
Belgian Self-Care Disability Correlation Chart

The statistical analysis conducted on geographies consisting of 355,581,666 people shows a poor negative correlation between the proportion of Belgians and percentage of population with self-care disability in the United States with a correlation coefficient (R) of -0.115 and weighted average of 2.4%. On average, for every 1% (one percent) increase in Belgians within a typical geography, there is a decrease of 0.022% in percentage of population with self-care disability.
Belgian Self-Care Disability
It is essential to understand that the correlation between the percentage of Belgians and percentage of population with self-care disability does not imply a direct cause-and-effect relationship. It remains uncertain whether the presence of Belgians influences an upward or downward trend in the level of percentage of population with self-care disability within an area, or if Belgians simply ended up residing in those areas with higher or lower levels of percentage of population with self-care disability due to other factors.

Demographics Similar to Belgians by Self-Care Disability

In terms of self-care disability, the demographic groups most similar to Belgians are Peruvian (2.4%, a difference of 0.070%), Immigrants from Nigeria (2.4%, a difference of 0.080%), Immigrants from North America (2.4%, a difference of 0.090%), Immigrants from Morocco (2.4%, a difference of 0.090%), and Uruguayan (2.4%, a difference of 0.10%).
DemographicsRating | RankSelf-Care Disability
Immigrants from Hong Kong
93.1
/100
|
#115
Exceptional
2.4%
Northern Europeans
92.9
/100
|
#116
Exceptional
2.4%
Taiwanese
92.5
/100
|
#117
Exceptional
2.4%
Immigrants from Canada
92.0
/100
|
#118
Exceptional
2.4%
Immigrants from Sierra Leone
91.8
/100
|
#119
Exceptional
2.4%
Uruguayans
91.5
/100
|
#120
Exceptional
2.4%
Peruvians
91.3
/100
|
#121
Exceptional
2.4%
Belgians
90.9
/100
|
#122
Exceptional
2.4%
Immigrants from Nigeria
90.3
/100
|
#123
Exceptional
2.4%
Immigrants from North America
90.2
/100
|
#124
Exceptional
2.4%
Immigrants from Morocco
90.2
/100
|
#124
Exceptional
2.4%
Hmong
89.9
/100
|
#126
Excellent
2.4%
Colombians
89.7
/100
|
#127
Excellent
2.4%
Immigrants from Hungary
89.6
/100
|
#128
Excellent
2.4%
Immigrants from Romania
89.3
/100
|
#129
Excellent
2.4%

Belgian Self-Care Disability Correlation Summary

MeasurementBelgian DataSelf-Care Disability Data
Minimum0.099%0.39%
Maximum42.9%9.4%
Range42.9%9.0%
Mean12.5%2.8%
Median10.2%2.5%
Interquartile 25% (IQ1)5.1%1.9%
Interquartile 75% (IQ3)17.6%2.9%
Interquartile Range (IQR)12.4%1.0%
Standard Deviation (Sample)9.7%1.9%
Standard Deviation (Population)9.6%1.9%

Correlation Details

Belgian PercentileSample SizeSelf-Care Disability
[
0.0%
-
0.5%
]
0.099%
335,000,1132.4%
[
0.5%
-
1.0%
]
0.58%
13,601,4242.3%
[
1.0%
-
1.5%
]
1.03%
3,489,2512.5%
[
1.0%
-
1.5%
]
1.46%
1,103,0122.4%
[
1.5%
-
2.0%
]
1.88%
626,0052.4%
[
2.0%
-
2.5%
]
2.34%
391,9322.8%
[
2.5%
-
3.0%
]
2.74%
289,3642.6%
[
3.0%
-
3.5%
]
3.17%
186,8262.3%
[
3.5%
-
4.0%
]
3.60%
115,0321.9%
[
3.5%
-
4.0%
]
3.99%
57,0983.0%
[
4.0%
-
4.5%
]
4.43%
58,0512.5%
[
4.5%
-
5.0%
]
4.93%
162,3381.8%
[
5.0%
-
5.5%
]
5.35%
76,8012.6%
[
5.5%
-
6.0%
]
5.72%
145,5972.5%
[
6.0%
-
6.5%
]
6.13%
26,2662.8%
[
6.5%
-
7.0%
]
6.52%
45,7172.8%
[
7.0%
-
7.5%
]
7.01%
28,0752.0%
[
7.0%
-
7.5%
]
7.34%
17,8943.6%
[
7.5%
-
8.0%
]
7.87%
9,8062.8%
[
8.0%
-
8.5%
]
8.35%
24,8941.5%
[
8.5%
-
9.0%
]
8.70%
1383.1%
[
9.0%
-
9.5%
]
9.23%
42,7602.0%
[
9.5%
-
10.0%
]
9.70%
16,1682.0%
[
9.5%
-
10.0%
]
9.96%
12,1032.2%
[
10.0%
-
10.5%
]
10.25%
7229.3%
[
10.5%
-
11.0%
]
10.94%
3,0171.5%
[
11.0%
-
11.5%
]
11.24%
1,7432.6%
[
11.5%
-
12.0%
]
11.71%
8714.4%
[
12.0%
-
12.5%
]
12.25%
5472.9%
[
12.5%
-
13.0%
]
12.59%
1359.4%
[
13.0%
-
13.5%
]
13.03%
1,4202.9%
[
13.0%
-
13.5%
]
13.45%
11,1533.3%
[
14.0%
-
14.5%
]
14.04%
578.8%
[
14.0%
-
14.5%
]
14.06%
1281.6%
[
14.5%
-
15.0%
]
14.80%
2772.9%
[
16.0%
-
16.5%
]
16.37%
2,4372.7%
[
16.5%
-
17.0%
]
16.67%
5,2903.2%
[
18.0%
-
18.5%
]
18.46%
3,2441.7%
[
18.5%
-
19.0%
]
18.80%
1,6810.75%
[
19.0%
-
19.5%
]
19.37%
7900.41%
[
22.0%
-
22.5%
]
22.37%
1,4530.80%
[
23.0%
-
23.5%
]
23.06%
4,9260.39%
[
24.0%
-
24.5%
]
24.39%
1,4642.6%
[
25.0%
-
25.5%
]
25.40%
1,0672.5%
[
26.0%
-
26.5%
]
26.31%
7,6361.5%
[
27.5%
-
28.0%
]
27.93%
2225.2%
[
32.5%
-
33.0%
]
32.78%
5981.1%
[
36.0%
-
36.5%
]
36.15%
1,9392.6%
[
42.5%
-
43.0%
]
42.95%
2,1841.2%