Belgian Disability
COMPARE
Belgian
Select to Compare
Disability
Belgian Disability
12.3%
DISABILITY
0.8/ 100
METRIC RATING
253rd/ 347
METRIC RANK
Belgian Disability Correlation Chart
The statistical analysis conducted on geographies consisting of 355,995,745 people shows a weak negative correlation between the proportion of Belgians and percentage of population with a disability in the United States with a correlation coefficient (R) of -0.219 and weighted average of 12.3%. On average, for every 1% (one percent) increase in Belgians within a typical geography, there is a decrease of 0.052% in percentage of population with a disability.
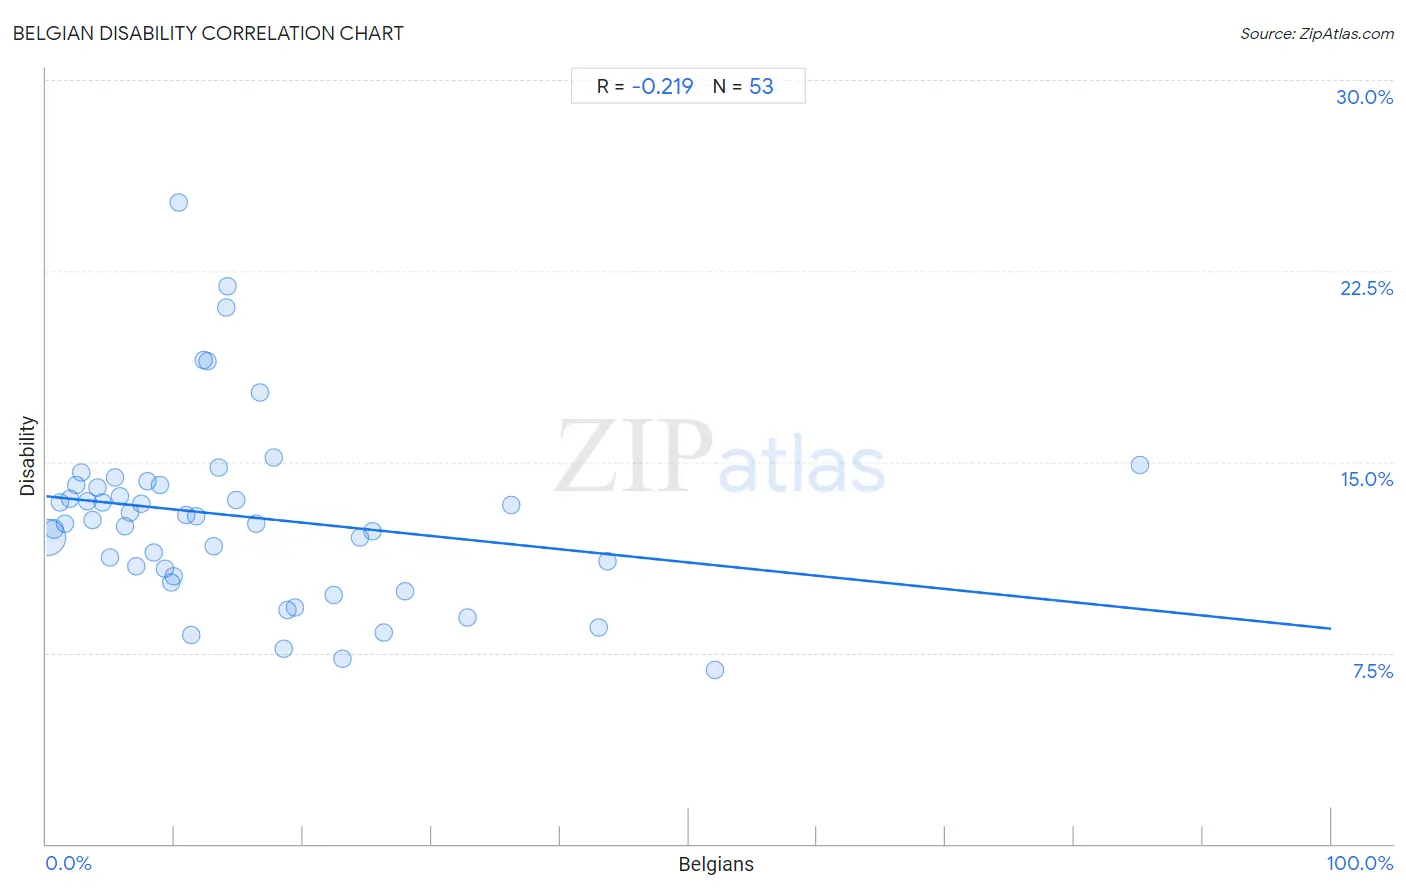
It is essential to understand that the correlation between the percentage of Belgians and percentage of population with a disability does not imply a direct cause-and-effect relationship. It remains uncertain whether the presence of Belgians influences an upward or downward trend in the level of percentage of population with a disability within an area, or if Belgians simply ended up residing in those areas with higher or lower levels of percentage of population with a disability due to other factors.
Demographics Similar to Belgians by Disability
In terms of disability, the demographic groups most similar to Belgians are German Russian (12.3%, a difference of 0.030%), Bermudan (12.3%, a difference of 0.31%), Slovene (12.4%, a difference of 0.35%), Immigrants from Dominica (12.4%, a difference of 0.42%), and Subsaharan African (12.3%, a difference of 0.50%).
| Demographics | Rating | Rank | Disability |
| Swiss | 1.5 /100 | #246 | Tragic 12.2% |
| Indonesians | 1.4 /100 | #247 | Tragic 12.2% |
| Guamanians/Chamorros | 1.4 /100 | #248 | Tragic 12.3% |
| Carpatho Rusyns | 1.4 /100 | #249 | Tragic 12.3% |
| Sub-Saharan Africans | 1.4 /100 | #250 | Tragic 12.3% |
| Europeans | 1.4 /100 | #251 | Tragic 12.3% |
| Bermudans | 1.1 /100 | #252 | Tragic 12.3% |
| Belgians | 0.8 /100 | #253 | Tragic 12.3% |
| German Russians | 0.8 /100 | #254 | Tragic 12.3% |
| Slovenes | 0.6 /100 | #255 | Tragic 12.4% |
| Immigrants from Dominica | 0.6 /100 | #256 | Tragic 12.4% |
| Immigrants from Laos | 0.5 /100 | #257 | Tragic 12.4% |
| Slavs | 0.5 /100 | #258 | Tragic 12.4% |
| Canadians | 0.4 /100 | #259 | Tragic 12.4% |
| Immigrants from Liberia | 0.4 /100 | #260 | Tragic 12.4% |
Belgian Disability Correlation Summary
| Measurement | Belgian Data | Disability Data |
| Minimum | 0.099% | 6.8% |
| Maximum | 85.1% | 25.2% |
| Range | 85.0% | 18.3% |
| Mean | 15.3% | 12.9% |
| Median | 11.2% | 12.7% |
| Interquartile 25% (IQ1) | 5.5% | 10.7% |
| Interquartile 75% (IQ3) | 19.1% | 14.1% |
| Interquartile Range (IQR) | 13.5% | 3.4% |
| Standard Deviation (Sample) | 15.2% | 3.6% |
| Standard Deviation (Population) | 15.0% | 3.6% |
Correlation Details
| Belgian Percentile | Sample Size | Disability |
[ 0.0% - 0.5% ] 0.099% | 335,247,676 | 12.0% |
[ 0.5% - 1.0% ] 0.58% | 13,659,157 | 12.4% |
[ 1.0% - 1.5% ] 1.03% | 3,530,807 | 13.4% |
[ 1.0% - 1.5% ] 1.46% | 1,126,622 | 12.6% |
[ 1.5% - 2.0% ] 1.88% | 633,462 | 13.6% |
[ 2.0% - 2.5% ] 2.34% | 401,472 | 14.1% |
[ 2.5% - 3.0% ] 2.74% | 292,416 | 14.6% |
[ 3.0% - 3.5% ] 3.17% | 190,341 | 13.5% |
[ 3.5% - 4.0% ] 3.60% | 116,599 | 12.7% |
[ 3.5% - 4.0% ] 3.99% | 60,176 | 14.0% |
[ 4.0% - 4.5% ] 4.43% | 58,298 | 13.4% |
[ 4.5% - 5.0% ] 4.93% | 164,200 | 11.2% |
[ 5.0% - 5.5% ] 5.35% | 77,902 | 14.4% |
[ 5.5% - 6.0% ] 5.72% | 148,103 | 13.6% |
[ 6.0% - 6.5% ] 6.13% | 27,017 | 12.5% |
[ 6.5% - 7.0% ] 6.52% | 46,383 | 13.0% |
[ 7.0% - 7.5% ] 7.01% | 29,840 | 10.9% |
[ 7.0% - 7.5% ] 7.34% | 18,980 | 13.3% |
[ 7.5% - 8.0% ] 7.88% | 10,468 | 14.2% |
[ 8.0% - 8.5% ] 8.35% | 25,583 | 11.4% |
[ 8.5% - 9.0% ] 8.82% | 578 | 14.1% |
[ 9.0% - 9.5% ] 9.23% | 42,760 | 10.8% |
[ 9.5% - 10.0% ] 9.69% | 18,115 | 10.3% |
[ 9.5% - 10.0% ] 9.96% | 12,103 | 10.5% |
[ 10.0% - 10.5% ] 10.30% | 1,378 | 25.2% |
[ 10.5% - 11.0% ] 10.94% | 3,017 | 12.9% |
[ 11.0% - 11.5% ] 11.24% | 1,743 | 8.2% |
[ 11.5% - 12.0% ] 11.71% | 871 | 12.9% |
[ 12.0% - 12.5% ] 12.25% | 547 | 19.0% |
[ 12.5% - 13.0% ] 12.59% | 135 | 18.9% |
[ 13.0% - 13.5% ] 13.03% | 1,420 | 11.7% |
[ 13.0% - 13.5% ] 13.45% | 11,153 | 14.8% |
[ 14.0% - 14.5% ] 14.04% | 57 | 21.1% |
[ 14.0% - 14.5% ] 14.06% | 128 | 21.9% |
[ 14.5% - 15.0% ] 14.76% | 481 | 13.5% |
[ 16.0% - 16.5% ] 16.37% | 2,437 | 12.6% |
[ 16.5% - 17.0% ] 16.67% | 5,290 | 17.7% |
[ 17.5% - 18.0% ] 17.72% | 237 | 15.2% |
[ 18.0% - 18.5% ] 18.46% | 3,244 | 7.7% |
[ 18.5% - 19.0% ] 18.80% | 1,681 | 9.2% |
[ 19.0% - 19.5% ] 19.37% | 790 | 9.3% |
[ 22.0% - 22.5% ] 22.37% | 1,453 | 9.8% |
[ 23.0% - 23.5% ] 23.06% | 4,926 | 7.3% |
[ 24.0% - 24.5% ] 24.39% | 1,464 | 12.0% |
[ 25.0% - 25.5% ] 25.40% | 1,067 | 12.3% |
[ 26.0% - 26.5% ] 26.31% | 7,636 | 8.3% |
[ 27.5% - 28.0% ] 27.96% | 565 | 9.9% |
[ 32.5% - 33.0% ] 32.78% | 598 | 8.9% |
[ 36.0% - 36.5% ] 36.15% | 1,939 | 13.3% |
[ 42.5% - 43.0% ] 42.95% | 2,184 | 8.5% |
[ 43.5% - 44.0% ] 43.65% | 126 | 11.1% |
[ 52.0% - 52.5% ] 52.05% | 73 | 6.8% |
[ 85.0% - 85.5% ] 85.11% | 47 | 14.9% |