Belgian College, Under 1 year

COMPARE

Belgian
Race
Ancestry
AfghanAfricanAlaska NativeAlaskan AthabascanAlbanianAleutAlsatianAmericanApacheArabArapahoArgentineanArmenianAssyrian/Chaldean/SyriacAustralianAustrianBahamianBangladeshiBarbadianBasqueBelgianBelizeanBermudanBhutaneseBlackfeetBolivianBrazilianBritishBritish West IndianBulgarianBurmeseCajunCambodianCanadianCape VerdeanCarpatho RusynCelticCentral AmericanCentral American IndianCherokeeCheyenneChickasawChileanChineseChippewaChoctawColombianColvilleComancheCosta RicanCreeCreekCroatianCrowCubanCypriotCzechCzechoslovakianDanishDelawareDominicanDutchDutch West IndianEastern EuropeanEcuadorianEgyptianEnglishEstonianEthiopianEuropeanFijianFilipinoFinnishFrenchFrench American IndianFrench CanadianGermanGerman RussianGhanaianGreekGuamanian/ChamorroGuatemalanGuyaneseHaitianHmongHonduranHopiHoumaHungarianIcelanderIndian (Asian)IndonesianInupiatIranianIraqiIrishIroquoisIsraeliItalianJamaicanJapaneseJordanianKenyanKiowaKoreanLaotianLatvianLebaneseLiberianLithuanianLumbeeLuxembourgerMacedonianMalaysianMalteseMarshalleseMenomineeMexicanMexican American IndianMongolianMoroccanNative HawaiianNavajoNepaleseNew ZealanderNicaraguanNigerianNorthern EuropeanNorwegianOkinawanOsageOttawaPaiutePakistaniPalestinianPanamanianParaguayanPennsylvania GermanPeruvianPimaPolishPortuguesePotawatomiPuebloPuerto RicanPuget Sound SalishRomanianRussianSalvadoranSamoanScandinavianScotch-IrishScottishSeminoleSenegaleseSerbianShoshoneSierra LeoneanSiouxSlavicSlovakSloveneSomaliSouth AfricanSouth AmericanSouth American IndianSoviet UnionSpaniardSpanishSpanish AmericanSpanish American IndianSri LankanSubsaharan AfricanSudaneseSwedishSwissSyrianTaiwaneseThaiTlingit-HaidaTohono O'OdhamTonganTrinidadian and TobagonianTsimshianTurkishU.S. Virgin IslanderUgandanUkrainianUruguayanUteVenezuelanVietnameseWelshWest IndianYakamaYaquiYugoslavianYumanYup'ikZimbabwean
Immigration
NonimmigrantsImmigrantsAfghanistanAfricaAlbaniaArgentinaArmeniaAsiaAustraliaAustriaBahamasBangladeshBarbadosBelarusBelgiumBelizeBoliviaBosnia and HerzegovinaBrazilBulgariaBurma/MyanmarCabo VerdeCambodiaCameroonCanadaCaribbeanCentral AmericaChileChinaColombiaCongoCosta RicaCroatiaCubaCzechoslovakiaDenmarkDominicaDominican RepublicEastern AfricaEastern AsiaEastern EuropeEcuadorEgyptEl SalvadorEnglandEritreaEthiopiaEuropeFijiFranceGermanyGhanaGreeceGrenadaGuatemalaGuyanaHaitiHondurasHong KongHungaryIndiaIndonesiaIranIraqIrelandIsraelItalyJamaicaJapanJordanKazakhstanKenyaKoreaKuwaitLaosLatin AmericaLatviaLebanonLiberiaLithuaniaMalaysiaMexicoMicronesiaMiddle AfricaMoldovaMoroccoNepalNetherlandsNicaraguaNigeriaNorth AmericaNorth MacedoniaNorthern AfricaNorthern EuropeNorwayOceaniaPakistanPanamaPeruPhilippinesPolandPortugalRomaniaRussiaSaudi ArabiaScotlandSenegalSerbiaSierra LeoneSingaporeSomaliaSouth AfricaSouth AmericaSouth Central AsiaSouth Eastern AsiaSouthern EuropeSpainSri LankaSt. Vincent and the GrenadinesSudanSwedenSwitzerlandSyriaTaiwanThailandTrinidad and TobagoTurkeyUgandaUkraineUruguayUzbekistanVenezuelaVietnamWest IndiesWestern AfricaWestern AsiaWestern EuropeYemenZaireZimbabweAzores
Select to Compare
Race
Ancestry
AfghanAfricanAlaska NativeAlaskan AthabascanAlbanianAleutAlsatianAmericanApacheArabArapahoArgentineanArmenianAssyrian/Chaldean/SyriacAustralianAustrianBahamianBangladeshiBarbadianBasqueBelizeanBermudanBhutaneseBlackfeetBolivianBrazilianBritishBritish West IndianBulgarianBurmeseCajunCambodianCanadianCape VerdeanCarpatho RusynCelticCentral AmericanCentral American IndianCherokeeCheyenneChickasawChileanChineseChippewaChoctawColombianColvilleComancheCosta RicanCreeCreekCroatianCrowCubanCypriotCzechCzechoslovakianDanishDelawareDominicanDutchDutch West IndianEastern EuropeanEcuadorianEgyptianEnglishEstonianEthiopianEuropeanFijianFilipinoFinnishFrenchFrench American IndianFrench CanadianGermanGerman RussianGhanaianGreekGuamanian/ChamorroGuatemalanGuyaneseHaitianHmongHonduranHopiHoumaHungarianIcelanderIndian (Asian)IndonesianInupiatIranianIraqiIrishIroquoisIsraeliItalianJamaicanJapaneseJordanianKenyanKiowaKoreanLaotianLatvianLebaneseLiberianLithuanianLumbeeLuxembourgerMacedonianMalaysianMalteseMarshalleseMenomineeMexicanMexican American IndianMongolianMoroccanNative HawaiianNavajoNepaleseNew ZealanderNicaraguanNigerianNorthern EuropeanNorwegianOkinawanOsageOttawaPaiutePakistaniPalestinianPanamanianParaguayanPennsylvania GermanPeruvianPimaPolishPortuguesePotawatomiPuebloPuerto RicanPuget Sound SalishRomanianRussianSalvadoranSamoanScandinavianScotch-IrishScottishSeminoleSenegaleseSerbianShoshoneSierra LeoneanSiouxSlavicSlovakSloveneSomaliSouth AfricanSouth AmericanSouth American IndianSoviet UnionSpaniardSpanishSpanish AmericanSpanish American IndianSri LankanSubsaharan AfricanSudaneseSwedishSwissSyrianTaiwaneseThaiTlingit-HaidaTohono O'OdhamTonganTrinidadian and TobagonianTsimshianTurkishU.S. Virgin IslanderUgandanUkrainianUruguayanUteVenezuelanVietnameseWelshWest IndianYakamaYaquiYugoslavianYumanYup'ikZimbabwean
Immigration
NonimmigrantsImmigrantsAfghanistanAfricaAlbaniaArgentinaArmeniaAsiaAustraliaAustriaBahamasBangladeshBarbadosBelarusBelgiumBelizeBoliviaBosnia and HerzegovinaBrazilBulgariaBurma/MyanmarCabo VerdeCambodiaCameroonCanadaCaribbeanCentral AmericaChileChinaColombiaCongoCosta RicaCroatiaCubaCzechoslovakiaDenmarkDominicaDominican RepublicEastern AfricaEastern AsiaEastern EuropeEcuadorEgyptEl SalvadorEnglandEritreaEthiopiaEuropeFijiFranceGermanyGhanaGreeceGrenadaGuatemalaGuyanaHaitiHondurasHong KongHungaryIndiaIndonesiaIranIraqIrelandIsraelItalyJamaicaJapanJordanKazakhstanKenyaKoreaKuwaitLaosLatin AmericaLatviaLebanonLiberiaLithuaniaMalaysiaMexicoMicronesiaMiddle AfricaMoldovaMoroccoNepalNetherlandsNicaraguaNigeriaNorth AmericaNorth MacedoniaNorthern AfricaNorthern EuropeNorwayOceaniaPakistanPanamaPeruPhilippinesPolandPortugalRomaniaRussiaSaudi ArabiaScotlandSenegalSerbiaSierra LeoneSingaporeSomaliaSouth AfricaSouth AmericaSouth Central AsiaSouth Eastern AsiaSouthern EuropeSpainSri LankaSt. Vincent and the GrenadinesSudanSwedenSwitzerlandSyriaTaiwanThailandTrinidad and TobagoTurkeyUgandaUkraineUruguayUzbekistanVenezuelaVietnamWest IndiesWestern AfricaWestern AsiaWestern EuropeYemenZaireZimbabweAzores
College, Under 1 year
Income
Poverty
Unemployment
Labor Participation
Family Structure
Vehicle Availability
Education Level
Disability

Belgian College, Under 1 year
Good

66.2%
COLLEGE, UNDER 1 YEAR
73.7/ 100
METRIC RATING
153rd/ 347
METRIC RANK

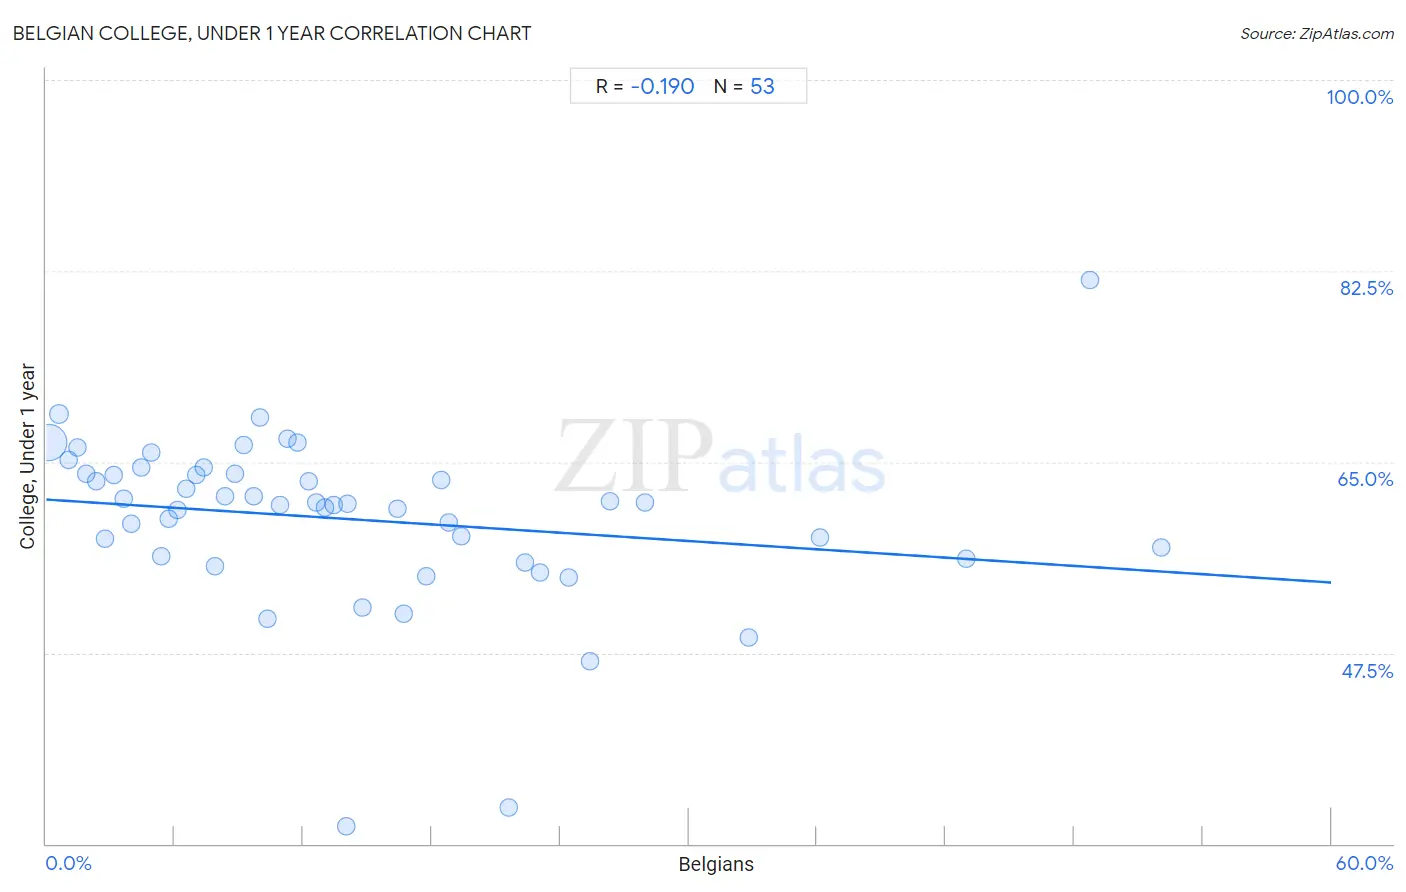
Belgian College, Under 1 year Correlation Chart

The statistical analysis conducted on geographies consisting of 356,017,450 people shows a poor negative correlation between the proportion of Belgians and percentage of population with at least college, under 1 year education in the United States with a correlation coefficient (R) of -0.190 and weighted average of 66.2%. On average, for every 1% (one percent) increase in Belgians within a typical geography, there is a decrease of 0.13% in percentage of population with at least college, under 1 year education.
Belgian College, Under 1 year
It is essential to understand that the correlation between the percentage of Belgians and percentage of population with at least college, under 1 year education does not imply a direct cause-and-effect relationship. It remains uncertain whether the presence of Belgians influences an upward or downward trend in the level of percentage of population with at least college, under 1 year education within an area, or if Belgians simply ended up residing in those areas with higher or lower levels of percentage of population with at least college, under 1 year education due to other factors.

Demographics Similar to Belgians by College, Under 1 year

In terms of college, under 1 year, the demographic groups most similar to Belgians are Sudanese (66.2%, a difference of 0.020%), Immigrants from Eritrea (66.1%, a difference of 0.10%), Immigrants from Sudan (66.2%, a difference of 0.13%), Irish (66.0%, a difference of 0.18%), and Immigrants from Iraq (66.3%, a difference of 0.20%).
DemographicsRating | RankCollege, Under 1 year
Kenyans
81.7
/100
|
#146
Excellent
66.5%
Immigrants from Morocco
81.7
/100
|
#147
Excellent
66.5%
Taiwanese
78.6
/100
|
#148
Good
66.4%
Immigrants from Venezuela
77.9
/100
|
#149
Good
66.3%
Immigrants from Iraq
77.1
/100
|
#150
Good
66.3%
Immigrants from Sudan
76.0
/100
|
#151
Good
66.2%
Sudanese
74.1
/100
|
#152
Good
66.2%
Belgians
73.7
/100
|
#153
Good
66.2%
Immigrants from Eritrea
71.9
/100
|
#154
Good
66.1%
Irish
70.3
/100
|
#155
Good
66.0%
Welsh
69.9
/100
|
#156
Good
66.0%
Sierra Leoneans
67.8
/100
|
#157
Good
66.0%
Celtics
67.3
/100
|
#158
Good
65.9%
Tlingit-Haida
66.4
/100
|
#159
Good
65.9%
Albanians
66.1
/100
|
#160
Good
65.9%

Belgian College, Under 1 year Correlation Summary

MeasurementBelgian DataCollege, Under 1 year Data
Minimum0.099%31.6%
Maximum52.1%81.6%
Range52.0%50.1%
Mean14.2%59.8%
Median11.2%61.1%
Interquartile 25% (IQ1)5.5%56.3%
Interquartile 75% (IQ3)19.1%63.9%
Interquartile Range (IQR)13.5%7.6%
Standard Deviation (Sample)11.9%8.0%
Standard Deviation (Population)11.8%7.9%

Correlation Details

Belgian PercentileSample SizeCollege, Under 1 year
[
0.0%
-
0.5%
]
0.099%
335,275,56466.7%
[
0.5%
-
1.0%
]
0.58%
13,659,44569.4%
[
1.0%
-
1.5%
]
1.03%
3,530,80765.2%
[
1.0%
-
1.5%
]
1.46%
1,117,55366.3%
[
1.5%
-
2.0%
]
1.88%
634,97663.9%
[
2.0%
-
2.5%
]
2.34%
402,11463.2%
[
2.5%
-
3.0%
]
2.74%
292,63857.9%
[
3.0%
-
3.5%
]
3.17%
190,34163.7%
[
3.5%
-
4.0%
]
3.60%
116,59961.7%
[
3.5%
-
4.0%
]
3.99%
60,17659.3%
[
4.0%
-
4.5%
]
4.43%
58,34264.5%
[
4.5%
-
5.0%
]
4.93%
164,20065.8%
[
5.0%
-
5.5%
]
5.35%
77,90256.4%
[
5.5%
-
6.0%
]
5.72%
148,10359.8%
[
6.0%
-
6.5%
]
6.13%
27,01760.6%
[
6.5%
-
7.0%
]
6.52%
46,38362.6%
[
7.0%
-
7.5%
]
7.01%
29,84063.8%
[
7.0%
-
7.5%
]
7.34%
18,98064.4%
[
7.5%
-
8.0%
]
7.88%
10,46855.4%
[
8.0%
-
8.5%
]
8.35%
25,58361.8%
[
8.5%
-
9.0%
]
8.82%
57863.9%
[
9.0%
-
9.5%
]
9.23%
42,76066.5%
[
9.5%
-
10.0%
]
9.69%
18,18761.8%
[
9.5%
-
10.0%
]
9.96%
12,10369.1%
[
10.0%
-
10.5%
]
10.30%
1,37850.6%
[
10.5%
-
11.0%
]
10.94%
3,01761.0%
[
11.0%
-
11.5%
]
11.24%
1,75267.1%
[
11.5%
-
12.0%
]
11.71%
87166.8%
[
12.0%
-
12.5%
]
12.25%
54763.3%
[
12.5%
-
13.0%
]
12.59%
13561.3%
[
13.0%
-
13.5%
]
13.03%
1,42060.8%
[
13.0%
-
13.5%
]
13.45%
11,15361.0%
[
14.0%
-
14.5%
]
14.04%
5731.6%
[
14.0%
-
14.5%
]
14.06%
12861.1%
[
14.5%
-
15.0%
]
14.76%
48151.7%
[
16.0%
-
16.5%
]
16.37%
2,43760.7%
[
16.5%
-
17.0%
]
16.67%
5,29051.0%
[
17.5%
-
18.0%
]
17.72%
23754.5%
[
18.0%
-
18.5%
]
18.46%
3,24463.4%
[
18.5%
-
19.0%
]
18.80%
1,68159.4%
[
19.0%
-
19.5%
]
19.37%
79058.2%
[
21.5%
-
22.0%
]
21.58%
19033.3%
[
22.0%
-
22.5%
]
22.37%
1,45355.8%
[
23.0%
-
23.5%
]
23.06%
4,92654.8%
[
24.0%
-
24.5%
]
24.39%
1,46454.4%
[
25.0%
-
25.5%
]
25.40%
1,06746.7%
[
26.0%
-
26.5%
]
26.31%
7,63661.4%
[
27.5%
-
28.0%
]
27.96%
56561.3%
[
32.5%
-
33.0%
]
32.78%
59848.9%
[
36.0%
-
36.5%
]
36.15%
1,93958.1%
[
42.5%
-
43.0%
]
42.95%
2,18456.1%
[
48.5%
-
49.0%
]
48.72%
7881.6%
[
52.0%
-
52.5%
]
52.05%
7357.1%