Belgian GED/Equivalency

COMPARE

Belgian
Race
Ancestry
AfghanAfricanAlaska NativeAlaskan AthabascanAlbanianAleutAlsatianAmericanApacheArabArapahoArgentineanArmenianAssyrian/Chaldean/SyriacAustralianAustrianBahamianBangladeshiBarbadianBasqueBelgianBelizeanBermudanBhutaneseBlackfeetBolivianBrazilianBritishBritish West IndianBulgarianBurmeseCajunCambodianCanadianCape VerdeanCarpatho RusynCelticCentral AmericanCentral American IndianCherokeeCheyenneChickasawChileanChineseChippewaChoctawColombianColvilleComancheCosta RicanCreeCreekCroatianCrowCubanCypriotCzechCzechoslovakianDanishDelawareDominicanDutchDutch West IndianEastern EuropeanEcuadorianEgyptianEnglishEstonianEthiopianEuropeanFijianFilipinoFinnishFrenchFrench American IndianFrench CanadianGermanGerman RussianGhanaianGreekGuamanian/ChamorroGuatemalanGuyaneseHaitianHmongHonduranHopiHoumaHungarianIcelanderIndian (Asian)IndonesianInupiatIranianIraqiIrishIroquoisIsraeliItalianJamaicanJapaneseJordanianKenyanKiowaKoreanLaotianLatvianLebaneseLiberianLithuanianLumbeeLuxembourgerMacedonianMalaysianMalteseMarshalleseMenomineeMexicanMexican American IndianMongolianMoroccanNative HawaiianNavajoNepaleseNew ZealanderNicaraguanNigerianNorthern EuropeanNorwegianOkinawanOsageOttawaPaiutePakistaniPalestinianPanamanianParaguayanPennsylvania GermanPeruvianPimaPolishPortuguesePotawatomiPuebloPuerto RicanPuget Sound SalishRomanianRussianSalvadoranSamoanScandinavianScotch-IrishScottishSeminoleSenegaleseSerbianShoshoneSierra LeoneanSiouxSlavicSlovakSloveneSomaliSouth AfricanSouth AmericanSouth American IndianSoviet UnionSpaniardSpanishSpanish AmericanSpanish American IndianSri LankanSubsaharan AfricanSudaneseSwedishSwissSyrianTaiwaneseThaiTlingit-HaidaTohono O'OdhamTonganTrinidadian and TobagonianTsimshianTurkishU.S. Virgin IslanderUgandanUkrainianUruguayanUteVenezuelanVietnameseWelshWest IndianYakamaYaquiYugoslavianYumanYup'ikZimbabwean
Immigration
NonimmigrantsImmigrantsAfghanistanAfricaAlbaniaArgentinaArmeniaAsiaAustraliaAustriaBahamasBangladeshBarbadosBelarusBelgiumBelizeBoliviaBosnia and HerzegovinaBrazilBulgariaBurma/MyanmarCabo VerdeCambodiaCameroonCanadaCaribbeanCentral AmericaChileChinaColombiaCongoCosta RicaCroatiaCubaCzechoslovakiaDenmarkDominicaDominican RepublicEastern AfricaEastern AsiaEastern EuropeEcuadorEgyptEl SalvadorEnglandEritreaEthiopiaEuropeFijiFranceGermanyGhanaGreeceGrenadaGuatemalaGuyanaHaitiHondurasHong KongHungaryIndiaIndonesiaIranIraqIrelandIsraelItalyJamaicaJapanJordanKazakhstanKenyaKoreaKuwaitLaosLatin AmericaLatviaLebanonLiberiaLithuaniaMalaysiaMexicoMicronesiaMiddle AfricaMoldovaMoroccoNepalNetherlandsNicaraguaNigeriaNorth AmericaNorth MacedoniaNorthern AfricaNorthern EuropeNorwayOceaniaPakistanPanamaPeruPhilippinesPolandPortugalRomaniaRussiaSaudi ArabiaScotlandSenegalSerbiaSierra LeoneSingaporeSomaliaSouth AfricaSouth AmericaSouth Central AsiaSouth Eastern AsiaSouthern EuropeSpainSri LankaSt. Vincent and the GrenadinesSudanSwedenSwitzerlandSyriaTaiwanThailandTrinidad and TobagoTurkeyUgandaUkraineUruguayUzbekistanVenezuelaVietnamWest IndiesWestern AfricaWestern AsiaWestern EuropeYemenZaireZimbabweAzores
Select to Compare
Race
Ancestry
AfghanAfricanAlaska NativeAlaskan AthabascanAlbanianAleutAlsatianAmericanApacheArabArapahoArgentineanArmenianAssyrian/Chaldean/SyriacAustralianAustrianBahamianBangladeshiBarbadianBasqueBelizeanBermudanBhutaneseBlackfeetBolivianBrazilianBritishBritish West IndianBulgarianBurmeseCajunCambodianCanadianCape VerdeanCarpatho RusynCelticCentral AmericanCentral American IndianCherokeeCheyenneChickasawChileanChineseChippewaChoctawColombianColvilleComancheCosta RicanCreeCreekCroatianCrowCubanCypriotCzechCzechoslovakianDanishDelawareDominicanDutchDutch West IndianEastern EuropeanEcuadorianEgyptianEnglishEstonianEthiopianEuropeanFijianFilipinoFinnishFrenchFrench American IndianFrench CanadianGermanGerman RussianGhanaianGreekGuamanian/ChamorroGuatemalanGuyaneseHaitianHmongHonduranHopiHoumaHungarianIcelanderIndian (Asian)IndonesianInupiatIranianIraqiIrishIroquoisIsraeliItalianJamaicanJapaneseJordanianKenyanKiowaKoreanLaotianLatvianLebaneseLiberianLithuanianLumbeeLuxembourgerMacedonianMalaysianMalteseMarshalleseMenomineeMexicanMexican American IndianMongolianMoroccanNative HawaiianNavajoNepaleseNew ZealanderNicaraguanNigerianNorthern EuropeanNorwegianOkinawanOsageOttawaPaiutePakistaniPalestinianPanamanianParaguayanPennsylvania GermanPeruvianPimaPolishPortuguesePotawatomiPuebloPuerto RicanPuget Sound SalishRomanianRussianSalvadoranSamoanScandinavianScotch-IrishScottishSeminoleSenegaleseSerbianShoshoneSierra LeoneanSiouxSlavicSlovakSloveneSomaliSouth AfricanSouth AmericanSouth American IndianSoviet UnionSpaniardSpanishSpanish AmericanSpanish American IndianSri LankanSubsaharan AfricanSudaneseSwedishSwissSyrianTaiwaneseThaiTlingit-HaidaTohono O'OdhamTonganTrinidadian and TobagonianTsimshianTurkishU.S. Virgin IslanderUgandanUkrainianUruguayanUteVenezuelanVietnameseWelshWest IndianYakamaYaquiYugoslavianYumanYup'ikZimbabwean
Immigration
NonimmigrantsImmigrantsAfghanistanAfricaAlbaniaArgentinaArmeniaAsiaAustraliaAustriaBahamasBangladeshBarbadosBelarusBelgiumBelizeBoliviaBosnia and HerzegovinaBrazilBulgariaBurma/MyanmarCabo VerdeCambodiaCameroonCanadaCaribbeanCentral AmericaChileChinaColombiaCongoCosta RicaCroatiaCubaCzechoslovakiaDenmarkDominicaDominican RepublicEastern AfricaEastern AsiaEastern EuropeEcuadorEgyptEl SalvadorEnglandEritreaEthiopiaEuropeFijiFranceGermanyGhanaGreeceGrenadaGuatemalaGuyanaHaitiHondurasHong KongHungaryIndiaIndonesiaIranIraqIrelandIsraelItalyJamaicaJapanJordanKazakhstanKenyaKoreaKuwaitLaosLatin AmericaLatviaLebanonLiberiaLithuaniaMalaysiaMexicoMicronesiaMiddle AfricaMoldovaMoroccoNepalNetherlandsNicaraguaNigeriaNorth AmericaNorth MacedoniaNorthern AfricaNorthern EuropeNorwayOceaniaPakistanPanamaPeruPhilippinesPolandPortugalRomaniaRussiaSaudi ArabiaScotlandSenegalSerbiaSierra LeoneSingaporeSomaliaSouth AfricaSouth AmericaSouth Central AsiaSouth Eastern AsiaSouthern EuropeSpainSri LankaSt. Vincent and the GrenadinesSudanSwedenSwitzerlandSyriaTaiwanThailandTrinidad and TobagoTurkeyUgandaUkraineUruguayUzbekistanVenezuelaVietnamWest IndiesWestern AfricaWestern AsiaWestern EuropeYemenZaireZimbabweAzores
GED/Equivalency
Income
Poverty
Unemployment
Labor Participation
Family Structure
Vehicle Availability
Education Level
Disability

Belgian GED/Equivalency
Exceptional

87.7%
GED/EQUIVALENCY
98.8/ 100
METRIC RATING
73rd/ 347
METRIC RANK

Belgian GED/Equivalency Correlation Chart

The statistical analysis conducted on geographies consisting of 356,019,518 people shows a substantial positive correlation between the proportion of Belgians and percentage of population with at least ged/equivalency education in the United States with a correlation coefficient (R) of 0.542 and weighted average of 87.7%. On average, for every 1% (one percent) increase in Belgians within a typical geography, there is an increase of 0.15% in percentage of population with at least ged/equivalency education.
Belgian GED/Equivalency
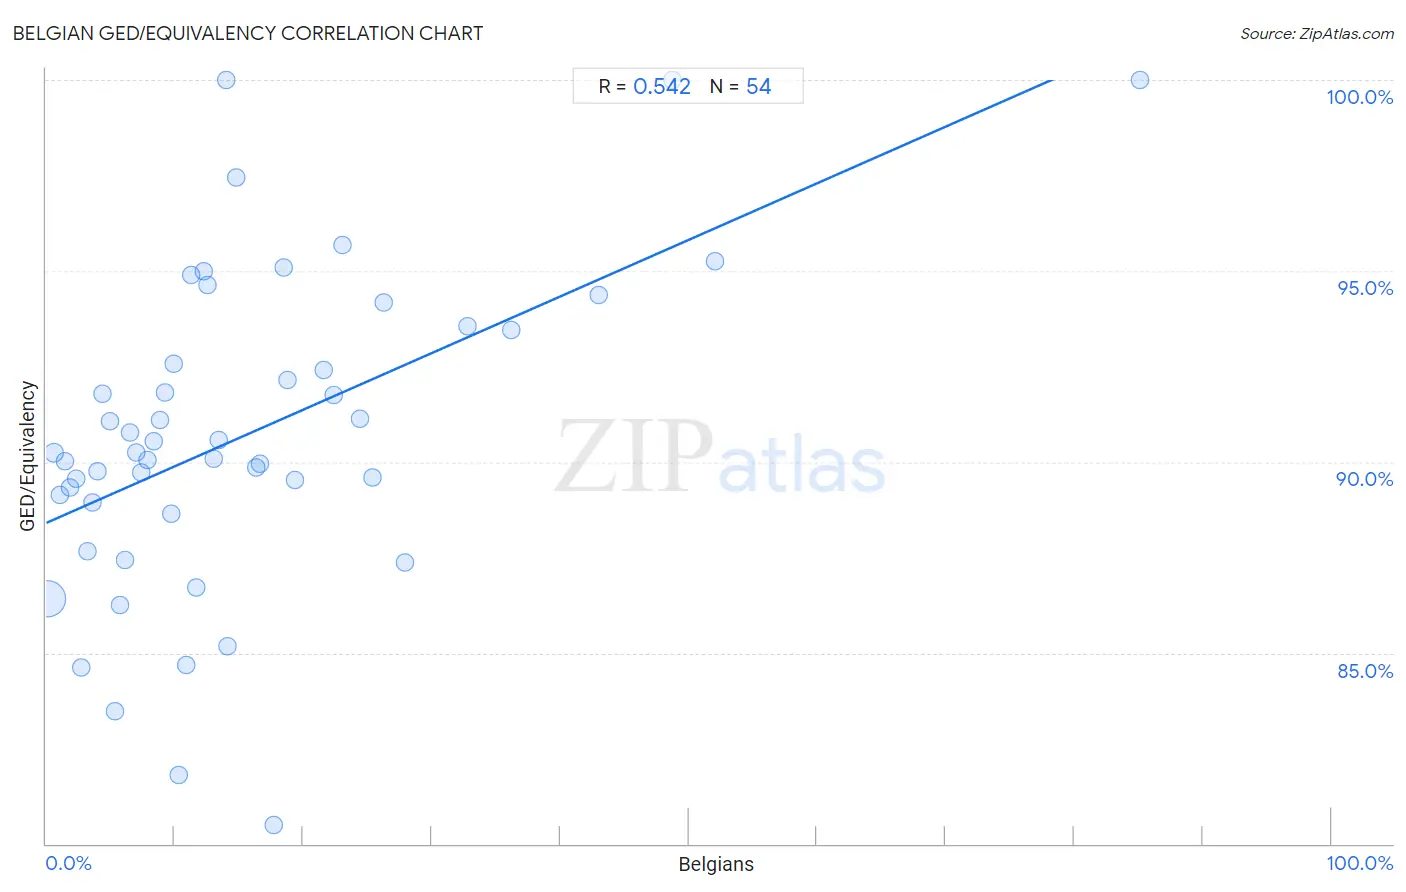
It is essential to understand that the correlation between the percentage of Belgians and percentage of population with at least ged/equivalency education does not imply a direct cause-and-effect relationship. It remains uncertain whether the presence of Belgians influences an upward or downward trend in the level of percentage of population with at least ged/equivalency education within an area, or if Belgians simply ended up residing in those areas with higher or lower levels of percentage of population with at least ged/equivalency education due to other factors.

Demographics Similar to Belgians by GED/Equivalency

In terms of ged/equivalency, the demographic groups most similar to Belgians are Ukrainian (87.7%, a difference of 0.010%), Austrian (87.7%, a difference of 0.010%), Immigrants from Moldova (87.7%, a difference of 0.010%), Immigrants from Kuwait (87.7%, a difference of 0.020%), and Scottish (87.7%, a difference of 0.030%).
DemographicsRating | RankGED/Equivalency
Immigrants from Bulgaria
99.1
/100
|
#66
Exceptional
87.8%
British
99.1
/100
|
#67
Exceptional
87.8%
Immigrants from France
99.1
/100
|
#68
Exceptional
87.8%
Immigrants from Saudi Arabia
99.0
/100
|
#69
Exceptional
87.8%
Ukrainians
98.8
/100
|
#70
Exceptional
87.7%
Austrians
98.8
/100
|
#71
Exceptional
87.7%
Immigrants from Moldova
98.8
/100
|
#72
Exceptional
87.7%
Belgians
98.8
/100
|
#73
Exceptional
87.7%
Immigrants from Kuwait
98.8
/100
|
#74
Exceptional
87.7%
Scottish
98.7
/100
|
#75
Exceptional
87.7%
Immigrants from Serbia
98.7
/100
|
#76
Exceptional
87.7%
Slavs
98.7
/100
|
#77
Exceptional
87.7%
Irish
98.6
/100
|
#78
Exceptional
87.6%
English
98.6
/100
|
#79
Exceptional
87.6%
Immigrants from England
98.5
/100
|
#80
Exceptional
87.6%

Belgian GED/Equivalency Correlation Summary

MeasurementBelgian DataGED/Equivalency Data
Minimum0.099%80.5%
Maximum85.1%100.0%
Range85.0%19.5%
Mean15.5%90.7%
Median11.5%90.2%
Interquartile 25% (IQ1)5.7%88.9%
Interquartile 75% (IQ3)19.4%93.5%
Interquartile Range (IQR)13.6%4.5%
Standard Deviation (Sample)15.2%4.2%
Standard Deviation (Population)15.1%4.1%

Correlation Details

Belgian PercentileSample SizeGED/Equivalency
[
0.0%
-
0.5%
]
0.099%
335,275,56486.4%
[
0.5%
-
1.0%
]
0.58%
13,661,46690.2%
[
1.0%
-
1.5%
]
1.03%
3,530,80789.1%
[
1.0%
-
1.5%
]
1.46%
1,117,55390.0%
[
1.5%
-
2.0%
]
1.88%
634,97689.3%
[
2.0%
-
2.5%
]
2.34%
402,11489.5%
[
2.5%
-
3.0%
]
2.74%
292,63884.6%
[
3.0%
-
3.5%
]
3.17%
190,34187.6%
[
3.5%
-
4.0%
]
3.60%
116,59988.9%
[
3.5%
-
4.0%
]
3.99%
60,17689.7%
[
4.0%
-
4.5%
]
4.43%
58,34291.8%
[
4.5%
-
5.0%
]
4.93%
164,20091.1%
[
5.0%
-
5.5%
]
5.35%
77,90283.5%
[
5.5%
-
6.0%
]
5.72%
148,10386.2%
[
6.0%
-
6.5%
]
6.13%
27,01787.4%
[
6.5%
-
7.0%
]
6.52%
46,38390.8%
[
7.0%
-
7.5%
]
7.01%
29,84090.3%
[
7.0%
-
7.5%
]
7.34%
18,98089.7%
[
7.5%
-
8.0%
]
7.88%
10,46890.1%
[
8.0%
-
8.5%
]
8.35%
25,58390.5%
[
8.5%
-
9.0%
]
8.82%
57891.1%
[
9.0%
-
9.5%
]
9.23%
42,76091.8%
[
9.5%
-
10.0%
]
9.69%
18,18788.6%
[
9.5%
-
10.0%
]
9.96%
12,10392.6%
[
10.0%
-
10.5%
]
10.30%
1,37881.8%
[
10.5%
-
11.0%
]
10.94%
3,01784.7%
[
11.0%
-
11.5%
]
11.24%
1,75294.9%
[
11.5%
-
12.0%
]
11.71%
87186.7%
[
12.0%
-
12.5%
]
12.25%
54795.0%
[
12.5%
-
13.0%
]
12.59%
13594.6%
[
13.0%
-
13.5%
]
13.03%
1,42090.1%
[
13.0%
-
13.5%
]
13.45%
11,15390.6%
[
14.0%
-
14.5%
]
14.04%
57100.0%
[
14.0%
-
14.5%
]
14.06%
12885.2%
[
14.5%
-
15.0%
]
14.76%
48197.5%
[
16.0%
-
16.5%
]
16.37%
2,43789.9%
[
16.5%
-
17.0%
]
16.67%
5,29090.0%
[
17.5%
-
18.0%
]
17.72%
23780.5%
[
18.0%
-
18.5%
]
18.46%
3,24495.1%
[
18.5%
-
19.0%
]
18.80%
1,68192.1%
[
19.0%
-
19.5%
]
19.37%
79089.5%
[
21.5%
-
22.0%
]
21.58%
19092.4%
[
22.0%
-
22.5%
]
22.37%
1,45391.8%
[
23.0%
-
23.5%
]
23.06%
4,92695.7%
[
24.0%
-
24.5%
]
24.39%
1,46491.1%
[
25.0%
-
25.5%
]
25.40%
1,06789.6%
[
26.0%
-
26.5%
]
26.31%
7,63694.2%
[
27.5%
-
28.0%
]
27.96%
56587.4%
[
32.5%
-
33.0%
]
32.78%
59893.5%
[
36.0%
-
36.5%
]
36.15%
1,93993.5%
[
42.5%
-
43.0%
]
42.95%
2,18494.4%
[
48.5%
-
49.0%
]
48.72%
78100.0%
[
52.0%
-
52.5%
]
52.05%
7395.2%
[
85.0%
-
85.5%
]
85.11%
47100.0%