Belgian Receiving Food Stamps

COMPARE

Belgian
Race
Ancestry
AfghanAfricanAlaska NativeAlaskan AthabascanAlbanianAleutAlsatianAmericanApacheArabArapahoArgentineanArmenianAssyrian/Chaldean/SyriacAustralianAustrianBahamianBangladeshiBarbadianBasqueBelgianBelizeanBermudanBhutaneseBlackfeetBolivianBrazilianBritishBritish West IndianBulgarianBurmeseCajunCambodianCanadianCape VerdeanCarpatho RusynCelticCentral AmericanCentral American IndianCherokeeCheyenneChickasawChileanChineseChippewaChoctawColombianColvilleComancheCosta RicanCreeCreekCroatianCrowCubanCypriotCzechCzechoslovakianDanishDelawareDominicanDutchDutch West IndianEastern EuropeanEcuadorianEgyptianEnglishEstonianEthiopianEuropeanFijianFilipinoFinnishFrenchFrench American IndianFrench CanadianGermanGerman RussianGhanaianGreekGuamanian/ChamorroGuatemalanGuyaneseHaitianHmongHonduranHopiHoumaHungarianIcelanderIndian (Asian)IndonesianInupiatIranianIraqiIrishIroquoisIsraeliItalianJamaicanJapaneseJordanianKenyanKiowaKoreanLaotianLatvianLebaneseLiberianLithuanianLumbeeLuxembourgerMacedonianMalaysianMalteseMarshalleseMenomineeMexicanMexican American IndianMongolianMoroccanNative HawaiianNavajoNepaleseNew ZealanderNicaraguanNigerianNorthern EuropeanNorwegianOkinawanOsageOttawaPaiutePakistaniPalestinianPanamanianParaguayanPennsylvania GermanPeruvianPimaPolishPortuguesePotawatomiPuebloPuerto RicanPuget Sound SalishRomanianRussianSalvadoranSamoanScandinavianScotch-IrishScottishSeminoleSenegaleseSerbianShoshoneSierra LeoneanSiouxSlavicSlovakSloveneSomaliSouth AfricanSouth AmericanSouth American IndianSoviet UnionSpaniardSpanishSpanish AmericanSpanish American IndianSri LankanSubsaharan AfricanSudaneseSwedishSwissSyrianTaiwaneseThaiTlingit-HaidaTohono O'OdhamTonganTrinidadian and TobagonianTsimshianTurkishU.S. Virgin IslanderUgandanUkrainianUruguayanUteVenezuelanVietnameseWelshWest IndianYakamaYaquiYugoslavianYumanYup'ikZimbabwean
Immigration
NonimmigrantsImmigrantsAfghanistanAfricaAlbaniaArgentinaArmeniaAsiaAustraliaAustriaBahamasBangladeshBarbadosBelarusBelgiumBelizeBoliviaBosnia and HerzegovinaBrazilBulgariaBurma/MyanmarCabo VerdeCambodiaCameroonCanadaCaribbeanCentral AmericaChileChinaColombiaCongoCosta RicaCroatiaCubaCzechoslovakiaDenmarkDominicaDominican RepublicEastern AfricaEastern AsiaEastern EuropeEcuadorEgyptEl SalvadorEnglandEritreaEthiopiaEuropeFijiFranceGermanyGhanaGreeceGrenadaGuatemalaGuyanaHaitiHondurasHong KongHungaryIndiaIndonesiaIranIraqIrelandIsraelItalyJamaicaJapanJordanKazakhstanKenyaKoreaKuwaitLaosLatin AmericaLatviaLebanonLiberiaLithuaniaMalaysiaMexicoMicronesiaMiddle AfricaMoldovaMoroccoNepalNetherlandsNicaraguaNigeriaNorth AmericaNorth MacedoniaNorthern AfricaNorthern EuropeNorwayOceaniaPakistanPanamaPeruPhilippinesPolandPortugalRomaniaRussiaSaudi ArabiaScotlandSenegalSerbiaSierra LeoneSingaporeSomaliaSouth AfricaSouth AmericaSouth Central AsiaSouth Eastern AsiaSouthern EuropeSpainSri LankaSt. Vincent and the GrenadinesSudanSwedenSwitzerlandSyriaTaiwanThailandTrinidad and TobagoTurkeyUgandaUkraineUruguayUzbekistanVenezuelaVietnamWest IndiesWestern AfricaWestern AsiaWestern EuropeYemenZaireZimbabweAzores
Select to Compare
Race
Ancestry
AfghanAfricanAlaska NativeAlaskan AthabascanAlbanianAleutAlsatianAmericanApacheArabArapahoArgentineanArmenianAssyrian/Chaldean/SyriacAustralianAustrianBahamianBangladeshiBarbadianBasqueBelizeanBermudanBhutaneseBlackfeetBolivianBrazilianBritishBritish West IndianBulgarianBurmeseCajunCambodianCanadianCape VerdeanCarpatho RusynCelticCentral AmericanCentral American IndianCherokeeCheyenneChickasawChileanChineseChippewaChoctawColombianColvilleComancheCosta RicanCreeCreekCroatianCrowCubanCypriotCzechCzechoslovakianDanishDelawareDominicanDutchDutch West IndianEastern EuropeanEcuadorianEgyptianEnglishEstonianEthiopianEuropeanFijianFilipinoFinnishFrenchFrench American IndianFrench CanadianGermanGerman RussianGhanaianGreekGuamanian/ChamorroGuatemalanGuyaneseHaitianHmongHonduranHopiHoumaHungarianIcelanderIndian (Asian)IndonesianInupiatIranianIraqiIrishIroquoisIsraeliItalianJamaicanJapaneseJordanianKenyanKiowaKoreanLaotianLatvianLebaneseLiberianLithuanianLumbeeLuxembourgerMacedonianMalaysianMalteseMarshalleseMenomineeMexicanMexican American IndianMongolianMoroccanNative HawaiianNavajoNepaleseNew ZealanderNicaraguanNigerianNorthern EuropeanNorwegianOkinawanOsageOttawaPaiutePakistaniPalestinianPanamanianParaguayanPennsylvania GermanPeruvianPimaPolishPortuguesePotawatomiPuebloPuerto RicanPuget Sound SalishRomanianRussianSalvadoranSamoanScandinavianScotch-IrishScottishSeminoleSenegaleseSerbianShoshoneSierra LeoneanSiouxSlavicSlovakSloveneSomaliSouth AfricanSouth AmericanSouth American IndianSoviet UnionSpaniardSpanishSpanish AmericanSpanish American IndianSri LankanSubsaharan AfricanSudaneseSwedishSwissSyrianTaiwaneseThaiTlingit-HaidaTohono O'OdhamTonganTrinidadian and TobagonianTsimshianTurkishU.S. Virgin IslanderUgandanUkrainianUruguayanUteVenezuelanVietnameseWelshWest IndianYakamaYaquiYugoslavianYumanYup'ikZimbabwean
Immigration
NonimmigrantsImmigrantsAfghanistanAfricaAlbaniaArgentinaArmeniaAsiaAustraliaAustriaBahamasBangladeshBarbadosBelarusBelgiumBelizeBoliviaBosnia and HerzegovinaBrazilBulgariaBurma/MyanmarCabo VerdeCambodiaCameroonCanadaCaribbeanCentral AmericaChileChinaColombiaCongoCosta RicaCroatiaCubaCzechoslovakiaDenmarkDominicaDominican RepublicEastern AfricaEastern AsiaEastern EuropeEcuadorEgyptEl SalvadorEnglandEritreaEthiopiaEuropeFijiFranceGermanyGhanaGreeceGrenadaGuatemalaGuyanaHaitiHondurasHong KongHungaryIndiaIndonesiaIranIraqIrelandIsraelItalyJamaicaJapanJordanKazakhstanKenyaKoreaKuwaitLaosLatin AmericaLatviaLebanonLiberiaLithuaniaMalaysiaMexicoMicronesiaMiddle AfricaMoldovaMoroccoNepalNetherlandsNicaraguaNigeriaNorth AmericaNorth MacedoniaNorthern AfricaNorthern EuropeNorwayOceaniaPakistanPanamaPeruPhilippinesPolandPortugalRomaniaRussiaSaudi ArabiaScotlandSenegalSerbiaSierra LeoneSingaporeSomaliaSouth AfricaSouth AmericaSouth Central AsiaSouth Eastern AsiaSouthern EuropeSpainSri LankaSt. Vincent and the GrenadinesSudanSwedenSwitzerlandSyriaTaiwanThailandTrinidad and TobagoTurkeyUgandaUkraineUruguayUzbekistanVenezuelaVietnamWest IndiesWestern AfricaWestern AsiaWestern EuropeYemenZaireZimbabweAzores
Receiving Food Stamps
Income
Poverty
Unemployment
Labor Participation
Family Structure
Vehicle Availability
Education Level
Disability

Belgian Receiving Food Stamps
Exceptional

10.2%
PUBLIC INCOME | FOOD STAMPS
97.7/ 100
METRIC RATING
93rd/ 347
METRIC RANK

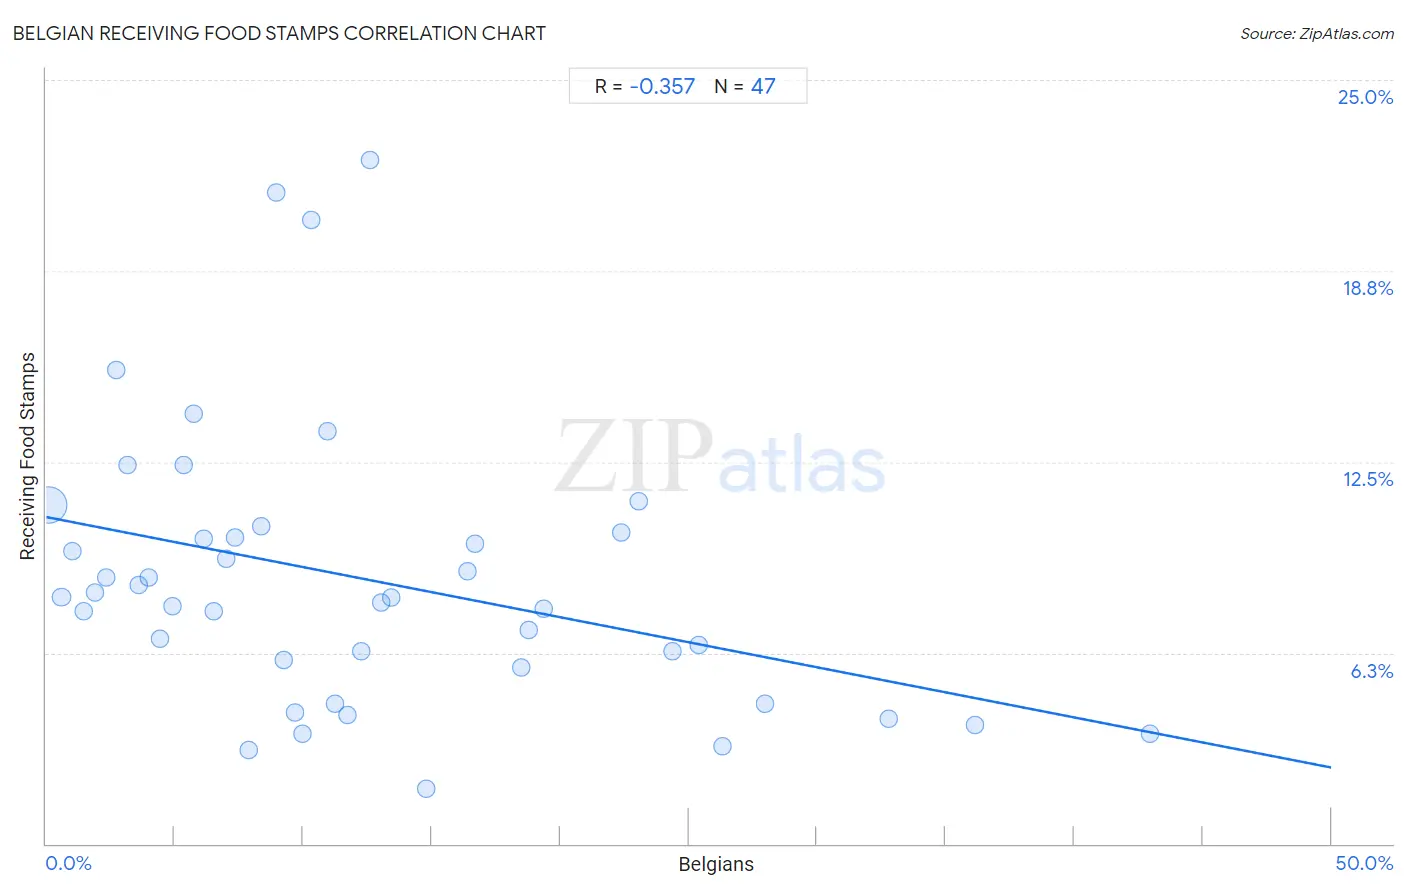
Belgian Receiving Food Stamps Correlation Chart

The statistical analysis conducted on geographies consisting of 355,046,721 people shows a mild negative correlation between the proportion of Belgians and percentage of population receiving government assistance and/or food stamps in the United States with a correlation coefficient (R) of -0.357 and weighted average of 10.2%. On average, for every 1% (one percent) increase in Belgians within a typical geography, there is a decrease of 0.16% in percentage of population receiving government assistance and/or food stamps.
Belgian Receiving Food Stamps
It is essential to understand that the correlation between the percentage of Belgians and percentage of population receiving government assistance and/or food stamps does not imply a direct cause-and-effect relationship. It remains uncertain whether the presence of Belgians influences an upward or downward trend in the level of percentage of population receiving government assistance and/or food stamps within an area, or if Belgians simply ended up residing in those areas with higher or lower levels of percentage of population receiving government assistance and/or food stamps due to other factors.

Demographics Similar to Belgians by Receiving Food Stamps

In terms of receiving food stamps, the demographic groups most similar to Belgians are Irish (10.2%, a difference of 0.38%), Jordanian (10.2%, a difference of 0.39%), Finnish (10.2%, a difference of 0.42%), Immigrants from Greece (10.3%, a difference of 0.53%), and Basque (10.3%, a difference of 0.55%).
DemographicsRating | RankReceiving Food Stamps
Immigrants from Norway
98.4
/100
|
#86
Exceptional
10.0%
Egyptians
98.4
/100
|
#87
Exceptional
10.0%
Immigrants from Kuwait
98.4
/100
|
#88
Exceptional
10.0%
Immigrants from France
98.3
/100
|
#89
Exceptional
10.1%
Finns
97.9
/100
|
#90
Exceptional
10.2%
Jordanians
97.9
/100
|
#91
Exceptional
10.2%
Irish
97.9
/100
|
#92
Exceptional
10.2%
Belgians
97.7
/100
|
#93
Exceptional
10.2%
Immigrants from Greece
97.4
/100
|
#94
Exceptional
10.3%
Basques
97.4
/100
|
#95
Exceptional
10.3%
Welsh
97.3
/100
|
#96
Exceptional
10.3%
Czechoslovakians
97.2
/100
|
#97
Exceptional
10.3%
Immigrants from Egypt
97.1
/100
|
#98
Exceptional
10.3%
Serbians
97.0
/100
|
#99
Exceptional
10.3%
Immigrants from Western Europe
96.9
/100
|
#100
Exceptional
10.3%

Belgian Receiving Food Stamps Correlation Summary

MeasurementBelgian DataReceiving Food Stamps Data
Minimum0.098%1.8%
Maximum42.9%22.4%
Range42.9%20.6%
Mean12.4%8.7%
Median10.0%8.1%
Interquartile 25% (IQ1)4.9%5.8%
Interquartile 75% (IQ3)18.5%10.2%
Interquartile Range (IQR)13.5%4.4%
Standard Deviation (Sample)9.9%4.6%
Standard Deviation (Population)9.8%4.5%

Correlation Details

Belgian PercentileSample SizeReceiving Food Stamps
[
0.0%
-
0.5%
]
0.098%
334,625,46711.1%
[
0.5%
-
1.0%
]
0.58%
13,502,3118.1%
[
1.0%
-
1.5%
]
1.03%
3,451,1799.6%
[
1.0%
-
1.5%
]
1.46%
1,087,6117.6%
[
1.5%
-
2.0%
]
1.88%
623,7178.2%
[
2.0%
-
2.5%
]
2.34%
389,3918.7%
[
2.5%
-
3.0%
]
2.74%
287,29415.5%
[
3.0%
-
3.5%
]
3.17%
182,67612.4%
[
3.5%
-
4.0%
]
3.60%
113,9968.5%
[
3.5%
-
4.0%
]
3.99%
59,1378.7%
[
4.0%
-
4.5%
]
4.43%
56,5536.7%
[
4.5%
-
5.0%
]
4.93%
161,5747.8%
[
5.0%
-
5.5%
]
5.36%
76,33312.4%
[
5.5%
-
6.0%
]
5.72%
146,50614.1%
[
6.0%
-
6.5%
]
6.13%
27,01710.0%
[
6.5%
-
7.0%
]
6.52%
45,9237.6%
[
7.0%
-
7.5%
]
7.01%
28,6749.3%
[
7.0%
-
7.5%
]
7.34%
18,19310.0%
[
7.5%
-
8.0%
]
7.88%
10,4683.1%
[
8.0%
-
8.5%
]
8.35%
25,32710.4%
[
8.5%
-
9.0%
]
8.93%
16821.3%
[
9.0%
-
9.5%
]
9.23%
42,6196.0%
[
9.5%
-
10.0%
]
9.70%
17,6194.3%
[
9.5%
-
10.0%
]
9.96%
12,1033.6%
[
10.0%
-
10.5%
]
10.30%
1,37820.4%
[
10.5%
-
11.0%
]
10.93%
2,56113.5%
[
11.0%
-
11.5%
]
11.24%
1,7434.6%
[
11.5%
-
12.0%
]
11.71%
8714.2%
[
12.0%
-
12.5%
]
12.25%
5476.3%
[
12.5%
-
13.0%
]
12.59%
13522.4%
[
13.0%
-
13.5%
]
13.03%
1,4207.9%
[
13.0%
-
13.5%
]
13.45%
10,8818.1%
[
14.5%
-
15.0%
]
14.80%
2771.8%
[
16.0%
-
16.5%
]
16.37%
2,4378.9%
[
16.5%
-
17.0%
]
16.67%
5,2909.8%
[
18.0%
-
18.5%
]
18.46%
3,2445.8%
[
18.5%
-
19.0%
]
18.80%
1,6817.0%
[
19.0%
-
19.5%
]
19.37%
7907.7%
[
22.0%
-
22.5%
]
22.37%
1,45310.2%
[
23.0%
-
23.5%
]
23.06%
4,92611.2%
[
24.0%
-
24.5%
]
24.39%
1,4646.3%
[
25.0%
-
25.5%
]
25.40%
1,0676.5%
[
26.0%
-
26.5%
]
26.31%
7,6363.2%
[
27.5%
-
28.0%
]
27.99%
3434.6%
[
32.5%
-
33.0%
]
32.78%
5984.1%
[
36.0%
-
36.5%
]
36.15%
1,9393.9%
[
42.5%
-
43.0%
]
42.95%
2,1843.6%