Belgian 4 or more Vehicles in Household
COMPARE
Belgian
Select to Compare
4 or more Vehicles in Household
Belgian 4 or more Vehicles in Household
6.8%
4+ VEHICLES AVAILABLE
94.1/ 100
METRIC RATING
126th/ 347
METRIC RANK
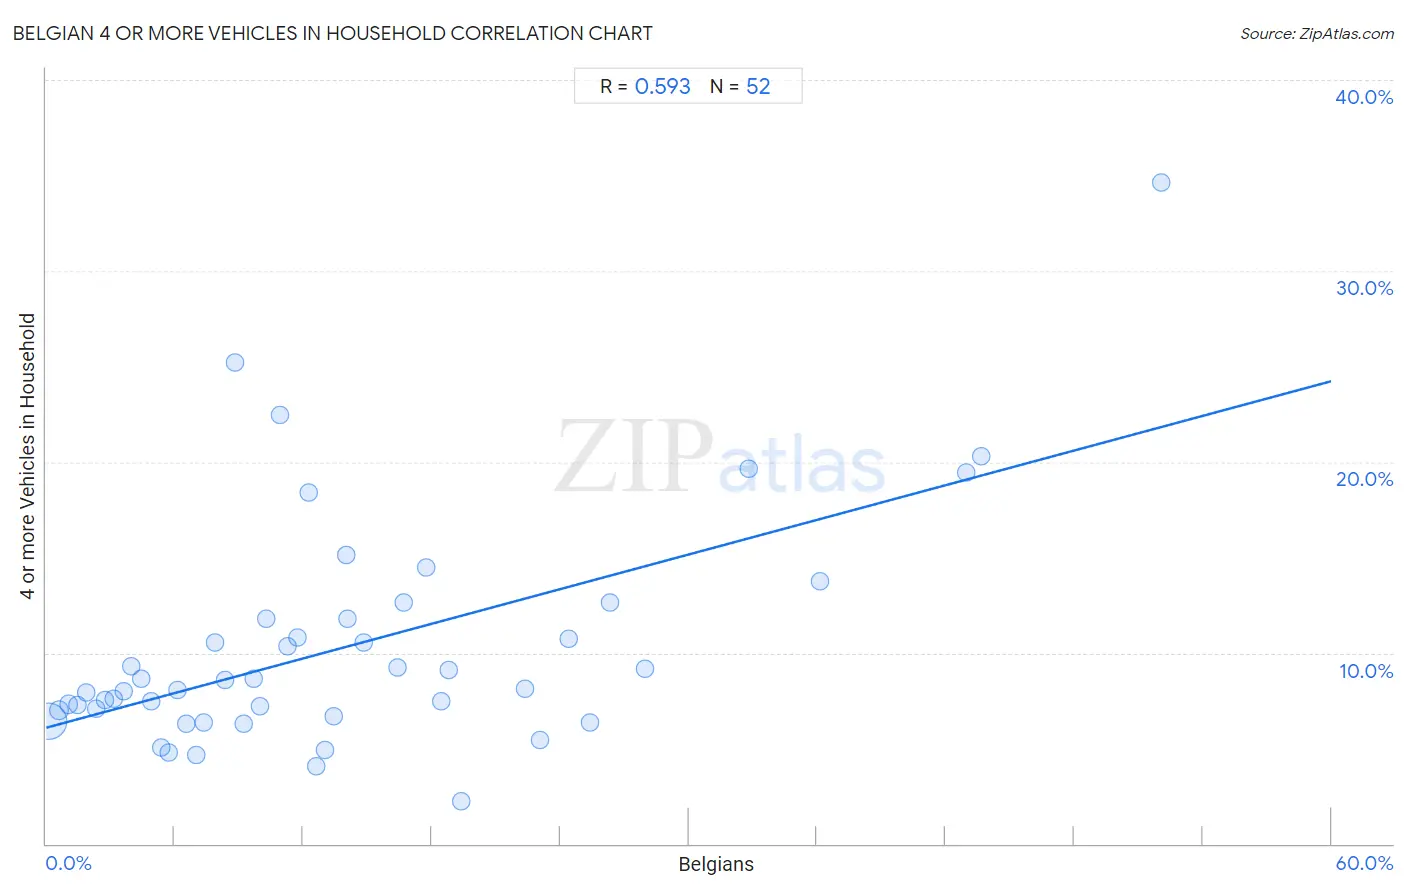
Belgian 4 or more Vehicles in Household Correlation Chart
The statistical analysis conducted on geographies consisting of 354,799,341 people shows a substantial positive correlation between the proportion of Belgians and percentage of households with 4 or more vehicles available in the United States with a correlation coefficient (R) of 0.593 and weighted average of 6.8%. On average, for every 1% (one percent) increase in Belgians within a typical geography, there is an increase of 0.30% in percentage of households with 4 or more vehicles available.
It is essential to understand that the correlation between the percentage of Belgians and percentage of households with 4 or more vehicles available does not imply a direct cause-and-effect relationship. It remains uncertain whether the presence of Belgians influences an upward or downward trend in the level of percentage of households with 4 or more vehicles available within an area, or if Belgians simply ended up residing in those areas with higher or lower levels of percentage of households with 4 or more vehicles available due to other factors.
Demographics Similar to Belgians by 4 or more Vehicles in Household
In terms of 4 or more vehicles in household, the demographic groups most similar to Belgians are Austrian (6.8%, a difference of 0.010%), Immigrants from Asia (6.8%, a difference of 0.10%), Immigrants from Korea (6.8%, a difference of 0.12%), Immigrants (6.8%, a difference of 0.20%), and Immigrants from Germany (6.8%, a difference of 0.27%).
| Demographics | Rating | Rank | 4 or more Vehicles in Household |
| Costa Ricans | 95.5 /100 | #119 | Exceptional 6.8% |
| Comanche | 94.8 /100 | #120 | Exceptional 6.8% |
| Immigrants from Germany | 94.7 /100 | #121 | Exceptional 6.8% |
| Immigrants from Nicaragua | 94.7 /100 | #122 | Exceptional 6.8% |
| Immigrants | 94.6 /100 | #123 | Exceptional 6.8% |
| Immigrants from Asia | 94.4 /100 | #124 | Exceptional 6.8% |
| Austrians | 94.1 /100 | #125 | Exceptional 6.8% |
| Belgians | 94.1 /100 | #126 | Exceptional 6.8% |
| Immigrants from Korea | 93.8 /100 | #127 | Exceptional 6.8% |
| Immigrants from Bolivia | 92.5 /100 | #128 | Exceptional 6.7% |
| Immigrants from England | 92.0 /100 | #129 | Exceptional 6.7% |
| Immigrants from Scotland | 89.0 /100 | #130 | Excellent 6.7% |
| Maltese | 88.4 /100 | #131 | Excellent 6.7% |
| Immigrants from Netherlands | 87.8 /100 | #132 | Excellent 6.6% |
| Armenians | 86.9 /100 | #133 | Excellent 6.6% |
Belgian 4 or more Vehicles in Household Correlation Summary
| Measurement | Belgian Data | 4 or more Vehicles in Household Data |
| Minimum | 0.099% | 2.2% |
| Maximum | 52.1% | 34.6% |
| Range | 52.0% | 32.4% |
| Mean | 13.9% | 10.3% |
| Median | 11.1% | 8.3% |
| Interquartile 25% (IQ1) | 5.5% | 6.8% |
| Interquartile 75% (IQ3) | 18.6% | 11.8% |
| Interquartile Range (IQR) | 13.1% | 4.9% |
| Standard Deviation (Sample) | 11.7% | 6.0% |
| Standard Deviation (Population) | 11.6% | 5.9% |
Correlation Details
| Belgian Percentile | Sample Size | 4 or more Vehicles in Household |
[ 0.0% - 0.5% ] 0.099% | 334,230,176 | 6.4% |
[ 0.5% - 1.0% ] 0.58% | 13,568,964 | 7.0% |
[ 1.0% - 1.5% ] 1.03% | 3,513,718 | 7.3% |
[ 1.0% - 1.5% ] 1.47% | 1,077,318 | 7.3% |
[ 1.5% - 2.0% ] 1.88% | 628,369 | 7.9% |
[ 2.0% - 2.5% ] 2.34% | 400,047 | 7.1% |
[ 2.5% - 3.0% ] 2.74% | 290,034 | 7.5% |
[ 3.0% - 3.5% ] 3.17% | 189,743 | 7.6% |
[ 3.5% - 4.0% ] 3.60% | 114,558 | 8.0% |
[ 3.5% - 4.0% ] 3.99% | 60,176 | 9.3% |
[ 4.0% - 4.5% ] 4.44% | 53,110 | 8.6% |
[ 4.5% - 5.0% ] 4.93% | 162,667 | 7.5% |
[ 5.0% - 5.5% ] 5.35% | 77,128 | 5.0% |
[ 5.5% - 6.0% ] 5.72% | 146,969 | 4.8% |
[ 6.0% - 6.5% ] 6.13% | 27,017 | 8.0% |
[ 6.5% - 7.0% ] 6.52% | 46,161 | 6.3% |
[ 7.0% - 7.5% ] 7.01% | 29,251 | 4.6% |
[ 7.0% - 7.5% ] 7.34% | 18,940 | 6.4% |
[ 7.5% - 8.0% ] 7.88% | 10,468 | 10.5% |
[ 8.0% - 8.5% ] 8.35% | 25,014 | 8.6% |
[ 8.5% - 9.0% ] 8.83% | 532 | 25.2% |
[ 9.0% - 9.5% ] 9.23% | 42,760 | 6.3% |
[ 9.5% - 10.0% ] 9.69% | 18,115 | 8.7% |
[ 9.5% - 10.0% ] 9.96% | 12,103 | 7.2% |
[ 10.0% - 10.5% ] 10.29% | 1,331 | 11.8% |
[ 10.5% - 11.0% ] 10.94% | 3,017 | 22.4% |
[ 11.0% - 11.5% ] 11.24% | 1,743 | 10.4% |
[ 11.5% - 12.0% ] 11.71% | 871 | 10.8% |
[ 12.0% - 12.5% ] 12.24% | 433 | 18.4% |
[ 12.5% - 13.0% ] 12.59% | 135 | 4.1% |
[ 13.0% - 13.5% ] 13.03% | 1,420 | 4.9% |
[ 13.0% - 13.5% ] 13.45% | 10,881 | 6.7% |
[ 14.0% - 14.5% ] 14.04% | 57 | 15.2% |
[ 14.0% - 14.5% ] 14.06% | 128 | 11.8% |
[ 14.5% - 15.0% ] 14.80% | 277 | 10.5% |
[ 16.0% - 16.5% ] 16.37% | 2,437 | 9.2% |
[ 16.5% - 17.0% ] 16.67% | 5,290 | 12.6% |
[ 17.5% - 18.0% ] 17.72% | 237 | 14.5% |
[ 18.0% - 18.5% ] 18.46% | 3,244 | 7.5% |
[ 18.5% - 19.0% ] 18.80% | 1,681 | 9.1% |
[ 19.0% - 19.5% ] 19.37% | 790 | 2.2% |
[ 22.0% - 22.5% ] 22.37% | 1,453 | 8.1% |
[ 23.0% - 23.5% ] 23.06% | 4,926 | 5.5% |
[ 24.0% - 24.5% ] 24.39% | 1,464 | 10.7% |
[ 25.0% - 25.5% ] 25.40% | 1,067 | 6.3% |
[ 26.0% - 26.5% ] 26.31% | 7,636 | 12.7% |
[ 27.5% - 28.0% ] 27.96% | 565 | 9.2% |
[ 32.5% - 33.0% ] 32.78% | 598 | 19.6% |
[ 36.0% - 36.5% ] 36.15% | 1,939 | 13.7% |
[ 42.5% - 43.0% ] 42.95% | 2,184 | 19.5% |
[ 43.5% - 44.0% ] 43.65% | 126 | 20.3% |
[ 52.0% - 52.5% ] 52.05% | 73 | 34.6% |