Syrian 4 or more Vehicles in Household
COMPARE
Syrian
Select to Compare
4 or more Vehicles in Household
Syrian 4 or more Vehicles in Household
6.3%
4+ VEHICLES AVAILABLE
42.0/ 100
METRIC RATING
180th/ 347
METRIC RANK
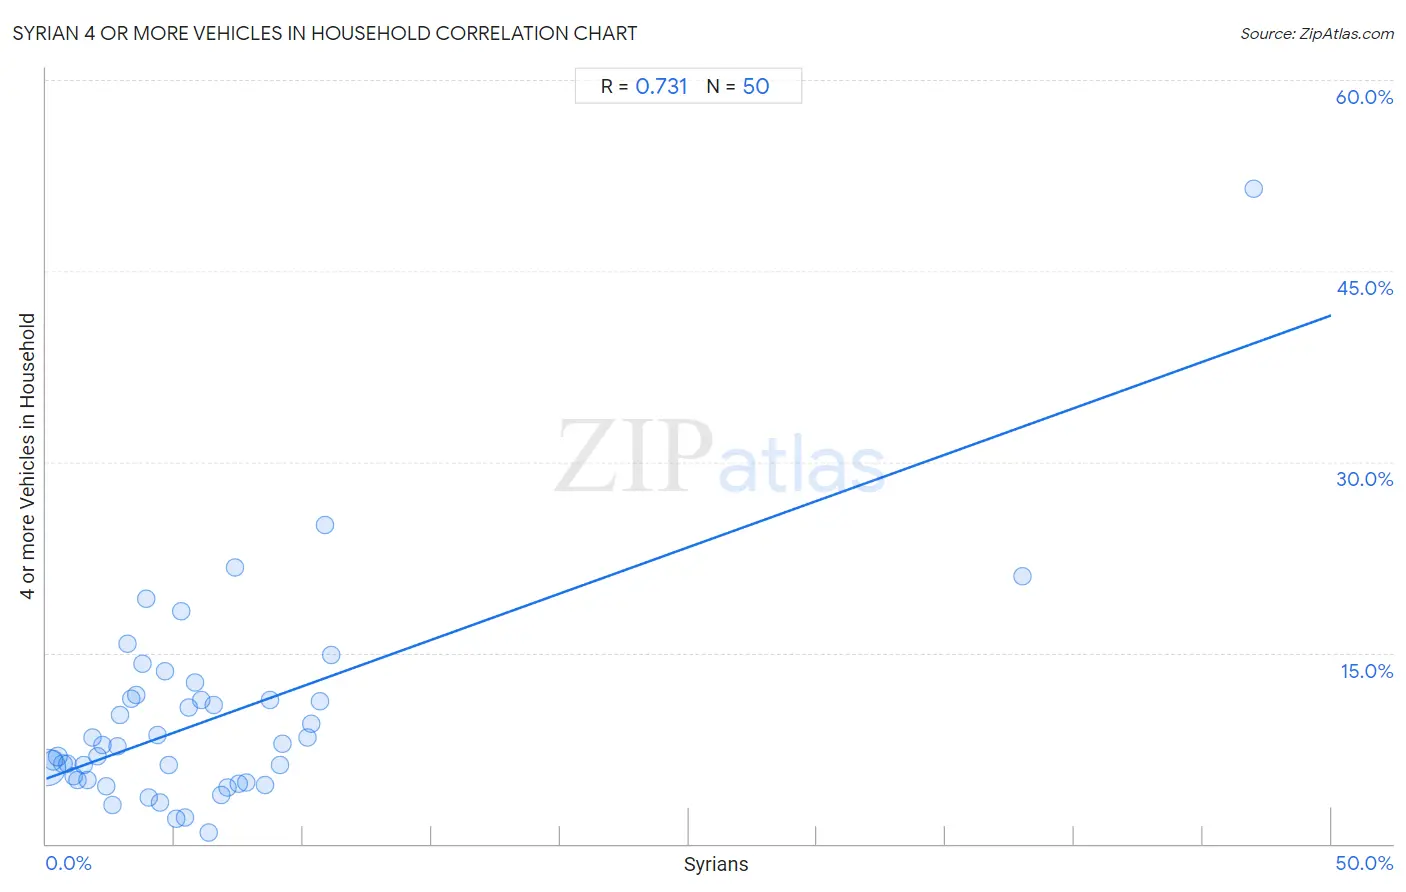
Syrian 4 or more Vehicles in Household Correlation Chart
The statistical analysis conducted on geographies consisting of 265,313,464 people shows a strong positive correlation between the proportion of Syrians and percentage of households with 4 or more vehicles available in the United States with a correlation coefficient (R) of 0.731 and weighted average of 6.3%. On average, for every 1% (one percent) increase in Syrians within a typical geography, there is an increase of 0.73% in percentage of households with 4 or more vehicles available.
It is essential to understand that the correlation between the percentage of Syrians and percentage of households with 4 or more vehicles available does not imply a direct cause-and-effect relationship. It remains uncertain whether the presence of Syrians influences an upward or downward trend in the level of percentage of households with 4 or more vehicles available within an area, or if Syrians simply ended up residing in those areas with higher or lower levels of percentage of households with 4 or more vehicles available due to other factors.
Demographics Similar to Syrians by 4 or more Vehicles in Household
In terms of 4 or more vehicles in household, the demographic groups most similar to Syrians are Yugoslavian (6.3%, a difference of 0.090%), Immigrants from Japan (6.3%, a difference of 0.11%), South American Indian (6.3%, a difference of 0.14%), Belizean (6.3%, a difference of 0.27%), and Immigrants from Burma/Myanmar (6.2%, a difference of 0.48%).
| Demographics | Rating | Rank | 4 or more Vehicles in Household |
| Slovenes | 51.1 /100 | #173 | Average 6.3% |
| Lithuanians | 50.0 /100 | #174 | Average 6.3% |
| Immigrants from Western Europe | 48.8 /100 | #175 | Average 6.3% |
| Ukrainians | 47.6 /100 | #176 | Average 6.3% |
| Slovaks | 46.9 /100 | #177 | Average 6.3% |
| Belizeans | 44.5 /100 | #178 | Average 6.3% |
| Immigrants from Japan | 43.1 /100 | #179 | Average 6.3% |
| Syrians | 42.0 /100 | #180 | Average 6.3% |
| Yugoslavians | 41.1 /100 | #181 | Average 6.3% |
| South American Indians | 40.7 /100 | #182 | Average 6.3% |
| Immigrants from Burma/Myanmar | 37.5 /100 | #183 | Fair 6.2% |
| Iraqis | 37.3 /100 | #184 | Fair 6.2% |
| Thais | 36.9 /100 | #185 | Fair 6.2% |
| Immigrants from Northern Europe | 36.8 /100 | #186 | Fair 6.2% |
| Immigrants from South Africa | 35.4 /100 | #187 | Fair 6.2% |
Syrian 4 or more Vehicles in Household Correlation Summary
| Measurement | Syrian Data | 4 or more Vehicles in Household Data |
| Minimum | 0.066% | 0.87% |
| Maximum | 47.0% | 51.4% |
| Range | 46.9% | 50.6% |
| Mean | 6.4% | 9.8% |
| Median | 4.7% | 7.7% |
| Interquartile 25% (IQ1) | 2.3% | 5.0% |
| Interquartile 75% (IQ3) | 7.5% | 11.4% |
| Interquartile Range (IQR) | 5.2% | 6.4% |
| Standard Deviation (Sample) | 8.1% | 8.1% |
| Standard Deviation (Population) | 8.0% | 8.0% |
Correlation Details
| Syrian Percentile | Sample Size | 4 or more Vehicles in Household |
[ 0.0% - 0.5% ] 0.066% | 222,802,088 | 6.0% |
[ 0.0% - 0.5% ] 0.27% | 26,104,051 | 6.6% |
[ 0.0% - 0.5% ] 0.46% | 7,448,714 | 6.9% |
[ 0.5% - 1.0% ] 0.65% | 3,620,523 | 6.3% |
[ 0.5% - 1.0% ] 0.84% | 1,697,382 | 6.3% |
[ 1.0% - 1.5% ] 1.05% | 1,519,177 | 5.3% |
[ 1.0% - 1.5% ] 1.22% | 636,173 | 5.0% |
[ 1.0% - 1.5% ] 1.44% | 400,406 | 6.2% |
[ 1.5% - 2.0% ] 1.63% | 215,101 | 5.0% |
[ 1.5% - 2.0% ] 1.79% | 140,012 | 8.4% |
[ 2.0% - 2.5% ] 2.00% | 135,426 | 6.9% |
[ 2.0% - 2.5% ] 2.17% | 95,224 | 7.8% |
[ 2.0% - 2.5% ] 2.34% | 57,792 | 4.5% |
[ 2.5% - 3.0% ] 2.57% | 171,370 | 3.0% |
[ 2.5% - 3.0% ] 2.79% | 13,781 | 7.6% |
[ 2.5% - 3.0% ] 2.87% | 28,467 | 10.1% |
[ 3.0% - 3.5% ] 3.14% | 6,552 | 15.7% |
[ 3.0% - 3.5% ] 3.33% | 24,477 | 11.4% |
[ 3.0% - 3.5% ] 3.49% | 19,625 | 11.7% |
[ 3.5% - 4.0% ] 3.73% | 6,415 | 14.1% |
[ 3.5% - 4.0% ] 3.88% | 1,341 | 19.3% |
[ 4.0% - 4.5% ] 4.01% | 17,623 | 3.6% |
[ 4.0% - 4.5% ] 4.34% | 12,105 | 8.5% |
[ 4.0% - 4.5% ] 4.42% | 814 | 3.2% |
[ 4.5% - 5.0% ] 4.60% | 261 | 13.5% |
[ 4.5% - 5.0% ] 4.77% | 43,607 | 6.2% |
[ 5.0% - 5.5% ] 5.07% | 1,125 | 1.9% |
[ 5.0% - 5.5% ] 5.25% | 1,238 | 18.3% |
[ 5.0% - 5.5% ] 5.39% | 1,057 | 2.0% |
[ 5.5% - 6.0% ] 5.57% | 6,377 | 10.7% |
[ 5.5% - 6.0% ] 5.80% | 138 | 12.7% |
[ 6.0% - 6.5% ] 6.01% | 5,007 | 11.3% |
[ 6.0% - 6.5% ] 6.32% | 1,551 | 0.87% |
[ 6.5% - 7.0% ] 6.53% | 2,022 | 10.9% |
[ 6.5% - 7.0% ] 6.82% | 44 | 3.8% |
[ 7.0% - 7.5% ] 7.03% | 17,250 | 4.4% |
[ 7.0% - 7.5% ] 7.34% | 2,699 | 21.7% |
[ 7.5% - 8.0% ] 7.51% | 852 | 4.8% |
[ 7.5% - 8.0% ] 7.76% | 438 | 4.8% |
[ 8.0% - 8.5% ] 8.50% | 412 | 4.6% |
[ 8.5% - 9.0% ] 8.68% | 645 | 11.2% |
[ 9.0% - 9.5% ] 9.08% | 16,358 | 6.2% |
[ 9.0% - 9.5% ] 9.21% | 29,286 | 7.9% |
[ 10.0% - 10.5% ] 10.14% | 3,323 | 8.4% |
[ 10.0% - 10.5% ] 10.30% | 728 | 9.5% |
[ 10.5% - 11.0% ] 10.67% | 1,097 | 11.2% |
[ 10.5% - 11.0% ] 10.84% | 83 | 25.0% |
[ 11.0% - 11.5% ] 11.08% | 2,960 | 14.8% |
[ 38.0% - 38.5% ] 38.00% | 150 | 21.1% |
[ 47.0% - 47.5% ] 47.01% | 117 | 51.4% |