Syrian 2 or more Vehicles in Household

COMPARE

Syrian
Race
Ancestry
AfghanAfricanAlaska NativeAlaskan AthabascanAlbanianAleutAlsatianAmericanApacheArabArapahoArgentineanArmenianAssyrian/Chaldean/SyriacAustralianAustrianBahamianBangladeshiBarbadianBasqueBelgianBelizeanBermudanBhutaneseBlackfeetBolivianBrazilianBritishBritish West IndianBulgarianBurmeseCajunCambodianCanadianCape VerdeanCarpatho RusynCelticCentral AmericanCentral American IndianCherokeeCheyenneChickasawChileanChineseChippewaChoctawColombianColvilleComancheCosta RicanCreeCreekCroatianCrowCubanCypriotCzechCzechoslovakianDanishDelawareDominicanDutchDutch West IndianEastern EuropeanEcuadorianEgyptianEnglishEstonianEthiopianEuropeanFijianFilipinoFinnishFrenchFrench American IndianFrench CanadianGermanGerman RussianGhanaianGreekGuamanian/ChamorroGuatemalanGuyaneseHaitianHmongHonduranHopiHoumaHungarianIcelanderIndian (Asian)IndonesianInupiatIranianIraqiIrishIroquoisIsraeliItalianJamaicanJapaneseJordanianKenyanKiowaKoreanLaotianLatvianLebaneseLiberianLithuanianLumbeeLuxembourgerMacedonianMalaysianMalteseMarshalleseMenomineeMexicanMexican American IndianMongolianMoroccanNative HawaiianNavajoNepaleseNew ZealanderNicaraguanNigerianNorthern EuropeanNorwegianOkinawanOsageOttawaPaiutePakistaniPalestinianPanamanianParaguayanPennsylvania GermanPeruvianPimaPolishPortuguesePotawatomiPuebloPuerto RicanPuget Sound SalishRomanianRussianSalvadoranSamoanScandinavianScotch-IrishScottishSeminoleSenegaleseSerbianShoshoneSierra LeoneanSiouxSlavicSlovakSloveneSomaliSouth AfricanSouth AmericanSouth American IndianSoviet UnionSpaniardSpanishSpanish AmericanSpanish American IndianSri LankanSubsaharan AfricanSudaneseSwedishSwissSyrianTaiwaneseThaiTlingit-HaidaTohono O'OdhamTonganTrinidadian and TobagonianTsimshianTurkishU.S. Virgin IslanderUgandanUkrainianUruguayanUteVenezuelanVietnameseWelshWest IndianYakamaYaquiYugoslavianYumanYup'ikZimbabwean
Immigration
NonimmigrantsImmigrantsAfghanistanAfricaAlbaniaArgentinaArmeniaAsiaAustraliaAustriaBahamasBangladeshBarbadosBelarusBelgiumBelizeBoliviaBosnia and HerzegovinaBrazilBulgariaBurma/MyanmarCabo VerdeCambodiaCameroonCanadaCaribbeanCentral AmericaChileChinaColombiaCongoCosta RicaCroatiaCubaCzechoslovakiaDenmarkDominicaDominican RepublicEastern AfricaEastern AsiaEastern EuropeEcuadorEgyptEl SalvadorEnglandEritreaEthiopiaEuropeFijiFranceGermanyGhanaGreeceGrenadaGuatemalaGuyanaHaitiHondurasHong KongHungaryIndiaIndonesiaIranIraqIrelandIsraelItalyJamaicaJapanJordanKazakhstanKenyaKoreaKuwaitLaosLatin AmericaLatviaLebanonLiberiaLithuaniaMalaysiaMexicoMicronesiaMiddle AfricaMoldovaMoroccoNepalNetherlandsNicaraguaNigeriaNorth AmericaNorth MacedoniaNorthern AfricaNorthern EuropeNorwayOceaniaPakistanPanamaPeruPhilippinesPolandPortugalRomaniaRussiaSaudi ArabiaScotlandSenegalSerbiaSierra LeoneSingaporeSomaliaSouth AfricaSouth AmericaSouth Central AsiaSouth Eastern AsiaSouthern EuropeSpainSri LankaSt. Vincent and the GrenadinesSudanSwedenSwitzerlandSyriaTaiwanThailandTrinidad and TobagoTurkeyUgandaUkraineUruguayUzbekistanVenezuelaVietnamWest IndiesWestern AfricaWestern AsiaWestern EuropeYemenZaireZimbabweAzores
Select to Compare
Race
Ancestry
AfghanAfricanAlaska NativeAlaskan AthabascanAlbanianAleutAlsatianAmericanApacheArabArapahoArgentineanArmenianAssyrian/Chaldean/SyriacAustralianAustrianBahamianBangladeshiBarbadianBasqueBelgianBelizeanBermudanBhutaneseBlackfeetBolivianBrazilianBritishBritish West IndianBulgarianBurmeseCajunCambodianCanadianCape VerdeanCarpatho RusynCelticCentral AmericanCentral American IndianCherokeeCheyenneChickasawChileanChineseChippewaChoctawColombianColvilleComancheCosta RicanCreeCreekCroatianCrowCubanCypriotCzechCzechoslovakianDanishDelawareDominicanDutchDutch West IndianEastern EuropeanEcuadorianEgyptianEnglishEstonianEthiopianEuropeanFijianFilipinoFinnishFrenchFrench American IndianFrench CanadianGermanGerman RussianGhanaianGreekGuamanian/ChamorroGuatemalanGuyaneseHaitianHmongHonduranHopiHoumaHungarianIcelanderIndian (Asian)IndonesianInupiatIranianIraqiIrishIroquoisIsraeliItalianJamaicanJapaneseJordanianKenyanKiowaKoreanLaotianLatvianLebaneseLiberianLithuanianLumbeeLuxembourgerMacedonianMalaysianMalteseMarshalleseMenomineeMexicanMexican American IndianMongolianMoroccanNative HawaiianNavajoNepaleseNew ZealanderNicaraguanNigerianNorthern EuropeanNorwegianOkinawanOsageOttawaPaiutePakistaniPalestinianPanamanianParaguayanPennsylvania GermanPeruvianPimaPolishPortuguesePotawatomiPuebloPuerto RicanPuget Sound SalishRomanianRussianSalvadoranSamoanScandinavianScotch-IrishScottishSeminoleSenegaleseSerbianShoshoneSierra LeoneanSiouxSlavicSlovakSloveneSomaliSouth AfricanSouth AmericanSouth American IndianSoviet UnionSpaniardSpanishSpanish AmericanSpanish American IndianSri LankanSubsaharan AfricanSudaneseSwedishSwissTaiwaneseThaiTlingit-HaidaTohono O'OdhamTonganTrinidadian and TobagonianTsimshianTurkishU.S. Virgin IslanderUgandanUkrainianUruguayanUteVenezuelanVietnameseWelshWest IndianYakamaYaquiYugoslavianYumanYup'ikZimbabwean
Immigration
NonimmigrantsImmigrantsAfghanistanAfricaAlbaniaArgentinaArmeniaAsiaAustraliaAustriaBahamasBangladeshBarbadosBelarusBelgiumBelizeBoliviaBosnia and HerzegovinaBrazilBulgariaBurma/MyanmarCabo VerdeCambodiaCameroonCanadaCaribbeanCentral AmericaChileChinaColombiaCongoCosta RicaCroatiaCubaCzechoslovakiaDenmarkDominicaDominican RepublicEastern AfricaEastern AsiaEastern EuropeEcuadorEgyptEl SalvadorEnglandEritreaEthiopiaEuropeFijiFranceGermanyGhanaGreeceGrenadaGuatemalaGuyanaHaitiHondurasHong KongHungaryIndiaIndonesiaIranIraqIrelandIsraelItalyJamaicaJapanJordanKazakhstanKenyaKoreaKuwaitLaosLatin AmericaLatviaLebanonLiberiaLithuaniaMalaysiaMexicoMicronesiaMiddle AfricaMoldovaMoroccoNepalNetherlandsNicaraguaNigeriaNorth AmericaNorth MacedoniaNorthern AfricaNorthern EuropeNorwayOceaniaPakistanPanamaPeruPhilippinesPolandPortugalRomaniaRussiaSaudi ArabiaScotlandSenegalSerbiaSierra LeoneSingaporeSomaliaSouth AfricaSouth AmericaSouth Central AsiaSouth Eastern AsiaSouthern EuropeSpainSri LankaSt. Vincent and the GrenadinesSudanSwedenSwitzerlandSyriaTaiwanThailandTrinidad and TobagoTurkeyUgandaUkraineUruguayUzbekistanVenezuelaVietnamWest IndiesWestern AfricaWestern AsiaWestern EuropeYemenZaireZimbabweAzores
2 or more Vehicles in Household
Income
Poverty
Unemployment
Labor Participation
Family Structure
Vehicle Availability
Education Level
Disability

Syrian 2 or more Vehicles in Household
Excellent

56.2%
2+ VEHICLES AVAILABLE
81.2/ 100
METRIC RATING
145th/ 347
METRIC RANK

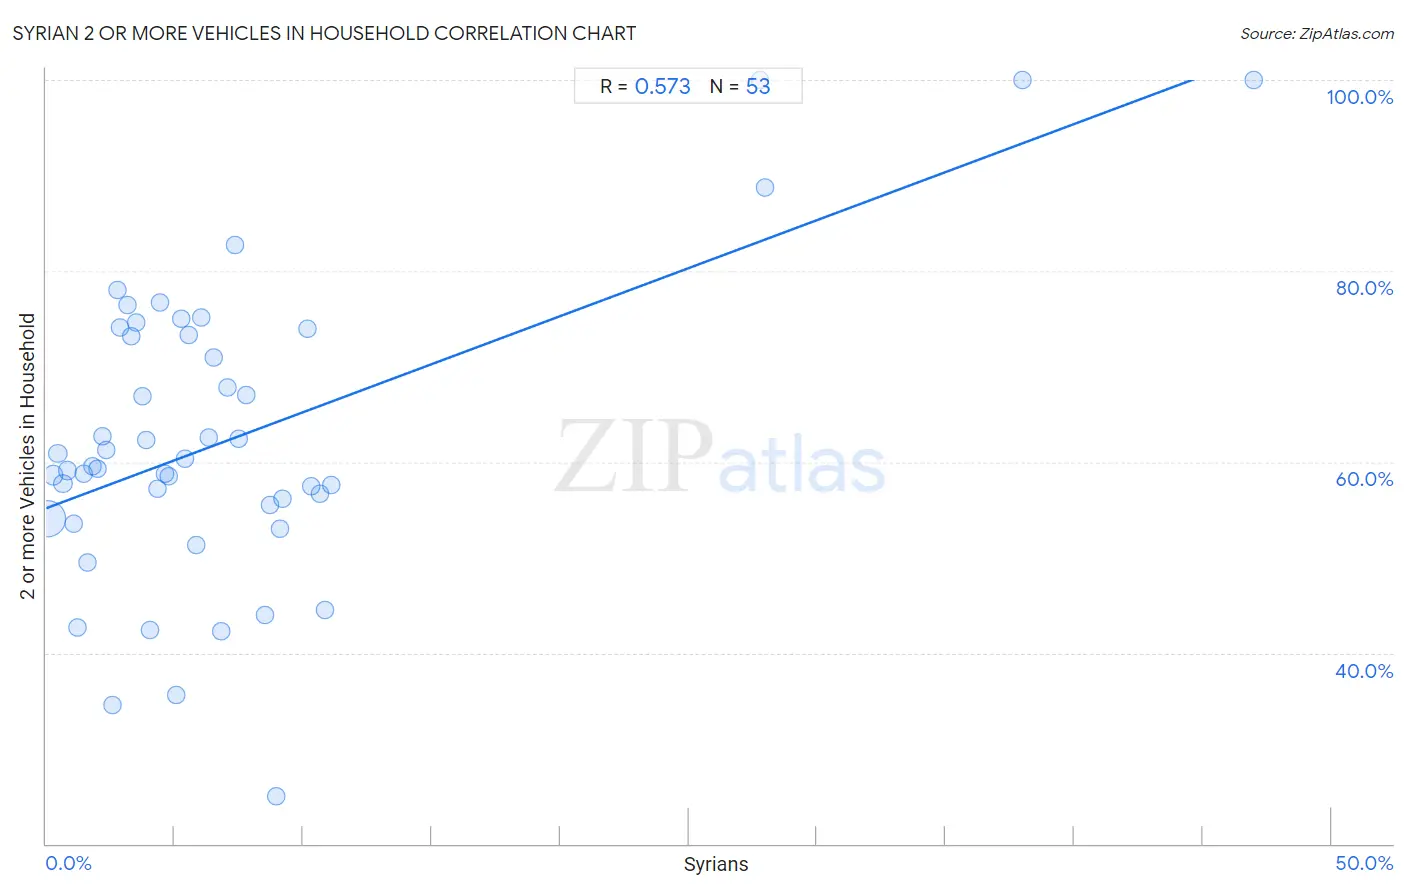
Syrian 2 or more Vehicles in Household Correlation Chart

The statistical analysis conducted on geographies consisting of 266,212,507 people shows a substantial positive correlation between the proportion of Syrians and percentage of households with 2 or more vehicles available in the United States with a correlation coefficient (R) of 0.573 and weighted average of 56.2%. On average, for every 1% (one percent) increase in Syrians within a typical geography, there is an increase of 1.0% in percentage of households with 2 or more vehicles available.
Syrian 2 or more Vehicles in Household
It is essential to understand that the correlation between the percentage of Syrians and percentage of households with 2 or more vehicles available does not imply a direct cause-and-effect relationship. It remains uncertain whether the presence of Syrians influences an upward or downward trend in the level of percentage of households with 2 or more vehicles available within an area, or if Syrians simply ended up residing in those areas with higher or lower levels of percentage of households with 2 or more vehicles available due to other factors.

Demographics Similar to Syrians by 2 or more Vehicles in Household

In terms of 2 or more vehicles in household, the demographic groups most similar to Syrians are Immigrants from Syria (56.2%, a difference of 0.010%), Seminole (56.2%, a difference of 0.030%), Venezuelan (56.1%, a difference of 0.030%), Serbian (56.1%, a difference of 0.060%), and Immigrants from Moldova (56.1%, a difference of 0.060%).
DemographicsRating | Rank2 or more Vehicles in Household
Salvadorans
84.7
/100
|
#138
Excellent
56.3%
Armenians
84.3
/100
|
#139
Excellent
56.3%
Latvians
83.6
/100
|
#140
Excellent
56.2%
Immigrants from Cambodia
83.6
/100
|
#141
Excellent
56.2%
South Africans
83.1
/100
|
#142
Excellent
56.2%
Seminole
81.7
/100
|
#143
Excellent
56.2%
Immigrants from Syria
81.4
/100
|
#144
Excellent
56.2%
Syrians
81.2
/100
|
#145
Excellent
56.2%
Venezuelans
80.7
/100
|
#146
Excellent
56.1%
Serbians
80.3
/100
|
#147
Excellent
56.1%
Immigrants from Moldova
80.2
/100
|
#148
Excellent
56.1%
Chileans
80.2
/100
|
#149
Excellent
56.1%
Nicaraguans
79.9
/100
|
#150
Good
56.1%
Immigrants from Northern Europe
78.7
/100
|
#151
Good
56.1%
Immigrants from Pakistan
78.1
/100
|
#152
Good
56.1%

Syrian 2 or more Vehicles in Household Correlation Summary

MeasurementSyrian Data2 or more Vehicles in Household Data
Minimum0.066%25.0%
Maximum47.0%100.0%
Range46.9%75.0%
Mean7.3%62.4%
Median5.1%59.5%
Interquartile 25% (IQ1)2.5%54.8%
Interquartile 75% (IQ3)8.6%73.6%
Interquartile Range (IQR)6.1%18.8%
Standard Deviation (Sample)8.9%15.6%
Standard Deviation (Population)8.8%15.5%

Correlation Details

Syrian PercentileSample Size2 or more Vehicles in Household
[
0.0%
-
0.5%
]
0.066%
223,408,87654.1%
[
0.0%
-
0.5%
]
0.27%
26,290,44358.6%
[
0.0%
-
0.5%
]
0.46%
7,482,19660.9%
[
0.5%
-
1.0%
]
0.65%
3,645,80257.8%
[
0.5%
-
1.0%
]
0.84%
1,702,83159.1%
[
1.0%
-
1.5%
]
1.05%
1,526,65753.6%
[
1.0%
-
1.5%
]
1.22%
644,09242.6%
[
1.0%
-
1.5%
]
1.44%
400,99058.8%
[
1.5%
-
2.0%
]
1.62%
230,67649.5%
[
1.5%
-
2.0%
]
1.79%
141,09059.5%
[
2.0%
-
2.5%
]
2.00%
135,85859.2%
[
2.0%
-
2.5%
]
2.17%
96,17062.7%
[
2.0%
-
2.5%
]
2.34%
58,90261.2%
[
2.5%
-
3.0%
]
2.57%
173,03234.6%
[
2.5%
-
3.0%
]
2.79%
13,78178.1%
[
2.5%
-
3.0%
]
2.87%
29,71474.0%
[
3.0%
-
3.5%
]
3.14%
6,55276.4%
[
3.0%
-
3.5%
]
3.33%
24,47773.2%
[
3.0%
-
3.5%
]
3.49%
19,62574.6%
[
3.5%
-
4.0%
]
3.73%
6,41566.9%
[
3.5%
-
4.0%
]
3.88%
1,34162.2%
[
4.0%
-
4.5%
]
4.01%
18,51642.4%
[
4.0%
-
4.5%
]
4.33%
12,53357.1%
[
4.0%
-
4.5%
]
4.42%
81476.7%
[
4.5%
-
5.0%
]
4.60%
26158.7%
[
4.5%
-
5.0%
]
4.77%
43,60758.5%
[
5.0%
-
5.5%
]
5.07%
1,12535.6%
[
5.0%
-
5.5%
]
5.25%
1,23875.0%
[
5.0%
-
5.5%
]
5.39%
2,65160.4%
[
5.5%
-
6.0%
]
5.57%
6,37773.2%
[
5.5%
-
6.0%
]
5.82%
18951.3%
[
6.0%
-
6.5%
]
6.01%
5,00775.1%
[
6.0%
-
6.5%
]
6.32%
1,55162.5%
[
6.5%
-
7.0%
]
6.53%
2,02271.0%
[
6.5%
-
7.0%
]
6.82%
4442.3%
[
7.0%
-
7.5%
]
7.03%
17,25067.8%
[
7.0%
-
7.5%
]
7.34%
2,69982.7%
[
7.5%
-
8.0%
]
7.51%
85262.4%
[
7.5%
-
8.0%
]
7.76%
43867.1%
[
8.0%
-
8.5%
]
8.50%
41244.0%
[
8.5%
-
9.0%
]
8.68%
64555.4%
[
8.5%
-
9.0%
]
8.93%
5625.0%
[
9.0%
-
9.5%
]
9.08%
16,35853.0%
[
9.0%
-
9.5%
]
9.21%
29,28656.1%
[
10.0%
-
10.5%
]
10.14%
3,32373.9%
[
10.0%
-
10.5%
]
10.30%
72857.4%
[
10.5%
-
11.0%
]
10.67%
1,09756.7%
[
10.5%
-
11.0%
]
10.84%
8344.4%
[
11.0%
-
11.5%
]
11.08%
2,96057.6%
[
27.5%
-
28.0%
]
27.78%
90100.0%
[
27.5%
-
28.0%
]
27.95%
50888.7%
[
38.0%
-
38.5%
]
38.00%
150100.0%
[
47.0%
-
47.5%
]
47.01%
117100.0%