Syrian College, Under 1 year
COMPARE
Syrian
Select to Compare
College, Under 1 year
Syrian College, Under 1 year
67.6%
COLLEGE, UNDER 1 YEAR
95.6/ 100
METRIC RATING
113th/ 347
METRIC RANK
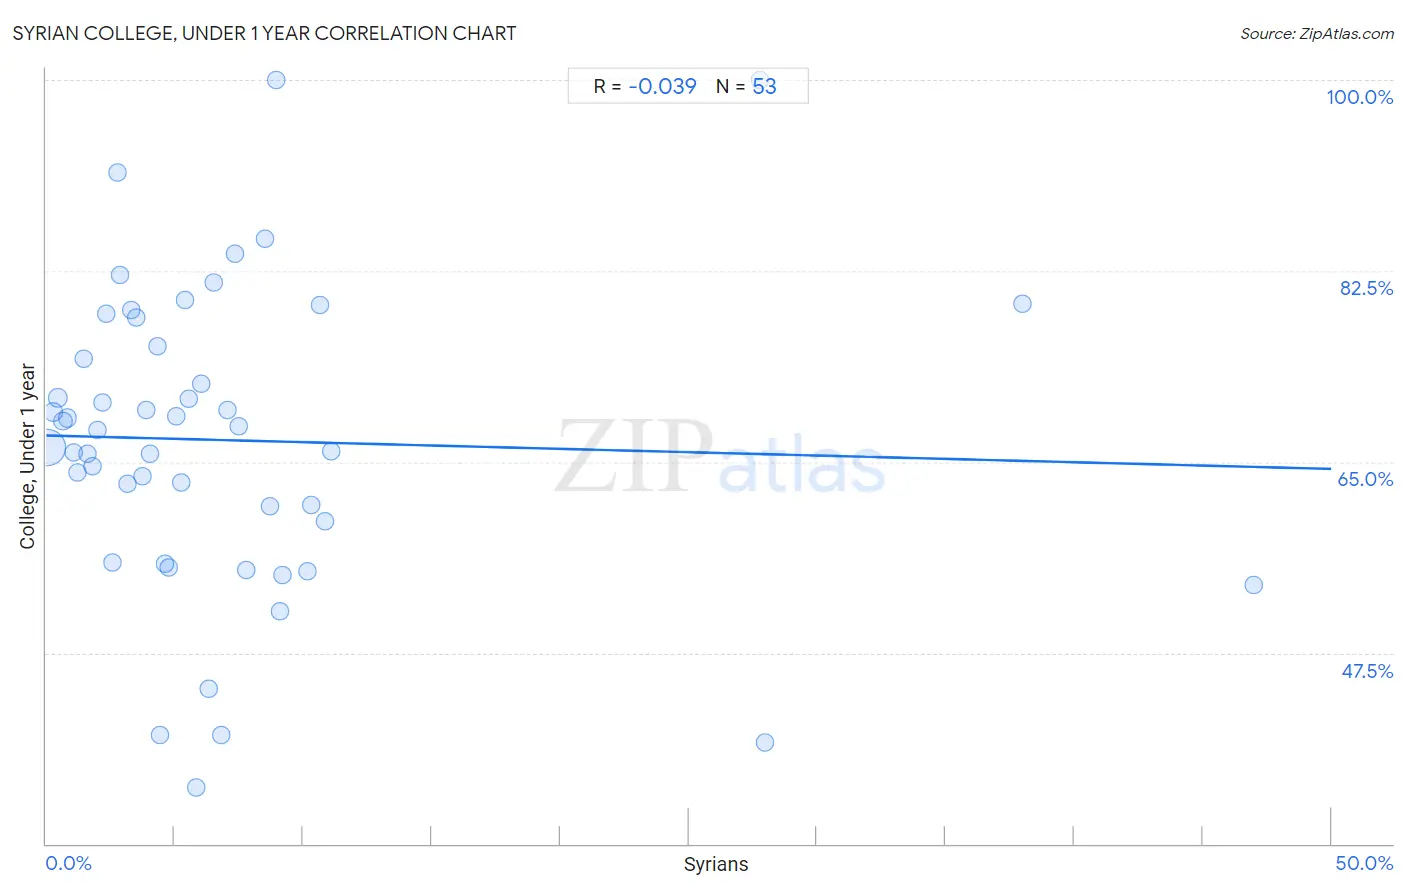
Syrian College, Under 1 year Correlation Chart
The statistical analysis conducted on geographies consisting of 266,306,496 people shows no correlation between the proportion of Syrians and percentage of population with at least college, under 1 year education in the United States with a correlation coefficient (R) of -0.039 and weighted average of 67.6%. On average, for every 1% (one percent) increase in Syrians within a typical geography, there is a decrease of 0.061% in percentage of population with at least college, under 1 year education.
It is essential to understand that the correlation between the percentage of Syrians and percentage of population with at least college, under 1 year education does not imply a direct cause-and-effect relationship. It remains uncertain whether the presence of Syrians influences an upward or downward trend in the level of percentage of population with at least college, under 1 year education within an area, or if Syrians simply ended up residing in those areas with higher or lower levels of percentage of population with at least college, under 1 year education due to other factors.
Demographics Similar to Syrians by College, Under 1 year
In terms of college, under 1 year, the demographic groups most similar to Syrians are Macedonian (67.6%, a difference of 0.030%), Assyrian/Chaldean/Syriac (67.7%, a difference of 0.040%), Ukrainian (67.7%, a difference of 0.040%), Scandinavian (67.7%, a difference of 0.050%), and Chilean (67.6%, a difference of 0.080%).
| Demographics | Rating | Rank | College, Under 1 year |
| Immigrants from Croatia | 96.6 /100 | #106 | Exceptional 67.8% |
| Austrians | 96.4 /100 | #107 | Exceptional 67.8% |
| Immigrants from Egypt | 96.0 /100 | #108 | Exceptional 67.7% |
| Scandinavians | 95.8 /100 | #109 | Exceptional 67.7% |
| Assyrians/Chaldeans/Syriacs | 95.8 /100 | #110 | Exceptional 67.7% |
| Ukrainians | 95.8 /100 | #111 | Exceptional 67.7% |
| Macedonians | 95.7 /100 | #112 | Exceptional 67.6% |
| Syrians | 95.6 /100 | #113 | Exceptional 67.6% |
| Chileans | 95.3 /100 | #114 | Exceptional 67.6% |
| Basques | 95.2 /100 | #115 | Exceptional 67.6% |
| Immigrants from Nepal | 94.9 /100 | #116 | Exceptional 67.5% |
| Pakistanis | 94.8 /100 | #117 | Exceptional 67.5% |
| Immigrants from Ukraine | 94.7 /100 | #118 | Exceptional 67.5% |
| Lebanese | 94.6 /100 | #119 | Exceptional 67.5% |
| Serbians | 93.9 /100 | #120 | Exceptional 67.4% |
Syrian College, Under 1 year Correlation Summary
| Measurement | Syrian Data | College, Under 1 year Data |
| Minimum | 0.066% | 35.1% |
| Maximum | 47.0% | 100.0% |
| Range | 46.9% | 64.9% |
| Mean | 7.3% | 67.0% |
| Median | 5.1% | 68.0% |
| Interquartile 25% (IQ1) | 2.5% | 57.7% |
| Interquartile 75% (IQ3) | 8.6% | 76.9% |
| Interquartile Range (IQR) | 6.1% | 19.2% |
| Standard Deviation (Sample) | 8.9% | 14.0% |
| Standard Deviation (Population) | 8.8% | 13.9% |
Correlation Details
| Syrian Percentile | Sample Size | College, Under 1 year |
[ 0.0% - 0.5% ] 0.066% | 223,465,429 | 66.4% |
[ 0.0% - 0.5% ] 0.27% | 26,317,515 | 69.6% |
[ 0.0% - 0.5% ] 0.46% | 7,484,335 | 70.9% |
[ 0.5% - 1.0% ] 0.65% | 3,648,045 | 68.7% |
[ 0.5% - 1.0% ] 0.84% | 1,708,470 | 69.0% |
[ 1.0% - 1.5% ] 1.05% | 1,526,657 | 65.9% |
[ 1.0% - 1.5% ] 1.22% | 644,092 | 64.0% |
[ 1.0% - 1.5% ] 1.44% | 400,990 | 74.4% |
[ 1.5% - 2.0% ] 1.62% | 230,676 | 65.7% |
[ 1.5% - 2.0% ] 1.79% | 141,433 | 64.6% |
[ 2.0% - 2.5% ] 2.00% | 135,858 | 68.0% |
[ 2.0% - 2.5% ] 2.17% | 96,170 | 70.4% |
[ 2.0% - 2.5% ] 2.34% | 58,902 | 78.5% |
[ 2.5% - 3.0% ] 2.57% | 173,032 | 55.7% |
[ 2.5% - 3.0% ] 2.79% | 13,781 | 91.5% |
[ 2.5% - 3.0% ] 2.87% | 29,714 | 82.1% |
[ 3.0% - 3.5% ] 3.14% | 6,552 | 63.0% |
[ 3.0% - 3.5% ] 3.33% | 24,477 | 78.9% |
[ 3.0% - 3.5% ] 3.49% | 19,625 | 78.3% |
[ 3.5% - 4.0% ] 3.73% | 6,415 | 63.7% |
[ 3.5% - 4.0% ] 3.88% | 1,341 | 69.8% |
[ 4.0% - 4.5% ] 4.01% | 18,516 | 65.7% |
[ 4.0% - 4.5% ] 4.33% | 12,533 | 75.5% |
[ 4.0% - 4.5% ] 4.42% | 814 | 39.9% |
[ 4.5% - 5.0% ] 4.60% | 261 | 55.6% |
[ 4.5% - 5.0% ] 4.77% | 43,607 | 55.3% |
[ 5.0% - 5.5% ] 5.07% | 1,125 | 69.2% |
[ 5.0% - 5.5% ] 5.25% | 1,238 | 63.1% |
[ 5.0% - 5.5% ] 5.39% | 2,651 | 79.8% |
[ 5.5% - 6.0% ] 5.57% | 6,377 | 70.8% |
[ 5.5% - 6.0% ] 5.82% | 189 | 35.1% |
[ 6.0% - 6.5% ] 6.01% | 5,007 | 72.2% |
[ 6.0% - 6.5% ] 6.32% | 1,551 | 44.2% |
[ 6.5% - 7.0% ] 6.53% | 2,022 | 81.4% |
[ 6.5% - 7.0% ] 6.82% | 44 | 40.0% |
[ 7.0% - 7.5% ] 7.03% | 17,250 | 69.7% |
[ 7.0% - 7.5% ] 7.34% | 2,699 | 84.1% |
[ 7.5% - 8.0% ] 7.51% | 852 | 68.2% |
[ 7.5% - 8.0% ] 7.76% | 438 | 55.1% |
[ 8.0% - 8.5% ] 8.50% | 412 | 85.5% |
[ 8.5% - 9.0% ] 8.68% | 645 | 60.9% |
[ 8.5% - 9.0% ] 8.93% | 56 | 100.0% |
[ 9.0% - 9.5% ] 9.08% | 16,358 | 51.3% |
[ 9.0% - 9.5% ] 9.21% | 29,286 | 54.6% |
[ 10.0% - 10.5% ] 10.14% | 3,323 | 55.0% |
[ 10.0% - 10.5% ] 10.30% | 728 | 61.0% |
[ 10.5% - 11.0% ] 10.67% | 1,097 | 79.4% |
[ 10.5% - 11.0% ] 10.84% | 83 | 59.6% |
[ 11.0% - 11.5% ] 11.08% | 2,960 | 66.0% |
[ 27.5% - 28.0% ] 27.78% | 90 | 100.0% |
[ 27.5% - 28.0% ] 27.95% | 508 | 39.2% |
[ 38.0% - 38.5% ] 38.00% | 150 | 79.5% |
[ 47.0% - 47.5% ] 47.01% | 117 | 53.7% |