Syrian Unemployment Among Women with Children Ages 6 to 17 years
COMPARE
Syrian
Select to Compare
Unemployment Among Women with Children Ages 6 to 17 years
Syrian Unemployment Among Women with Children Ages 6 to 17 years
9.2%
UNEMPLOYMENT | WOMEN W/ CHILDREN 6 TO 17
6.9/ 100
METRIC RATING
218th/ 347
METRIC RANK
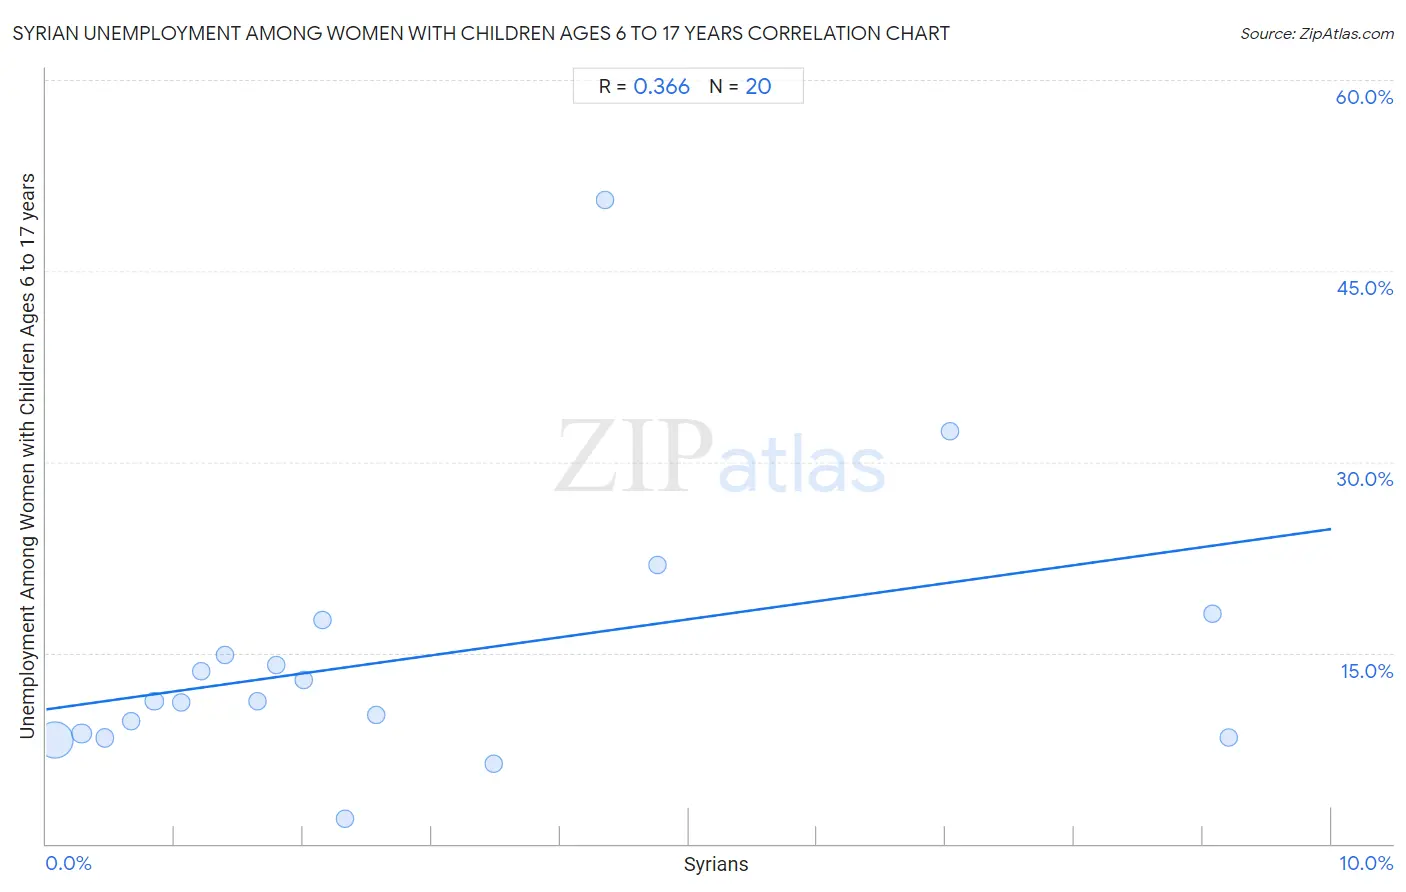
Syrian Unemployment Among Women with Children Ages 6 to 17 years Correlation Chart
The statistical analysis conducted on geographies consisting of 201,815,602 people shows a mild positive correlation between the proportion of Syrians and unemployment rate among women with children between the ages 6 and 17 in the United States with a correlation coefficient (R) of 0.366 and weighted average of 9.2%. On average, for every 1% (one percent) increase in Syrians within a typical geography, there is an increase of 1.4% in unemployment rate among women with children between the ages 6 and 17.
It is essential to understand that the correlation between the percentage of Syrians and unemployment rate among women with children between the ages 6 and 17 does not imply a direct cause-and-effect relationship. It remains uncertain whether the presence of Syrians influences an upward or downward trend in the level of unemployment rate among women with children between the ages 6 and 17 within an area, or if Syrians simply ended up residing in those areas with higher or lower levels of unemployment rate among women with children between the ages 6 and 17 due to other factors.
Demographics Similar to Syrians by Unemployment Among Women with Children Ages 6 to 17 years
In terms of unemployment among women with children ages 6 to 17 years, the demographic groups most similar to Syrians are German (9.2%, a difference of 0.050%), Immigrants from Scotland (9.2%, a difference of 0.050%), Immigrants from Germany (9.2%, a difference of 0.060%), Immigrants from Uruguay (9.2%, a difference of 0.060%), and Belgian (9.2%, a difference of 0.080%).
| Demographics | Rating | Rank | Unemployment Among Women with Children Ages 6 to 17 years |
| Immigrants from Cuba | 9.6 /100 | #211 | Tragic 9.2% |
| Peruvians | 9.0 /100 | #212 | Tragic 9.2% |
| Spaniards | 8.2 /100 | #213 | Tragic 9.2% |
| Iroquois | 7.5 /100 | #214 | Tragic 9.2% |
| Immigrants from Germany | 7.2 /100 | #215 | Tragic 9.2% |
| Immigrants from Uruguay | 7.2 /100 | #216 | Tragic 9.2% |
| Germans | 7.2 /100 | #217 | Tragic 9.2% |
| Syrians | 6.9 /100 | #218 | Tragic 9.2% |
| Immigrants from Scotland | 6.6 /100 | #219 | Tragic 9.2% |
| Belgians | 6.4 /100 | #220 | Tragic 9.2% |
| Crow | 5.8 /100 | #221 | Tragic 9.2% |
| Immigrants from Southern Europe | 5.8 /100 | #222 | Tragic 9.2% |
| Immigrants from Eritrea | 5.8 /100 | #223 | Tragic 9.2% |
| Immigrants from El Salvador | 5.3 /100 | #224 | Tragic 9.3% |
| Chinese | 5.2 /100 | #225 | Tragic 9.3% |
Syrian Unemployment Among Women with Children Ages 6 to 17 years Correlation Summary
| Measurement | Syrian Data | Unemployment Among Women with Children Ages 6 to 17 years Data |
| Minimum | 0.064% | 2.0% |
| Maximum | 9.2% | 50.6% |
| Range | 9.1% | 48.6% |
| Mean | 2.8% | 14.5% |
| Median | 1.9% | 11.2% |
| Interquartile 25% (IQ1) | 0.95% | 8.5% |
| Interquartile 75% (IQ3) | 3.9% | 16.2% |
| Interquartile Range (IQR) | 3.0% | 7.7% |
| Standard Deviation (Sample) | 2.8% | 10.7% |
| Standard Deviation (Population) | 2.7% | 10.4% |
Correlation Details
| Syrian Percentile | Sample Size | Unemployment Among Women with Children Ages 6 to 17 years |
[ 0.0% - 0.5% ] 0.064% | 176,390,976 | 8.2% |
[ 0.0% - 0.5% ] 0.27% | 16,228,307 | 8.7% |
[ 0.0% - 0.5% ] 0.46% | 4,013,656 | 8.3% |
[ 0.5% - 1.0% ] 0.66% | 1,998,417 | 9.7% |
[ 0.5% - 1.0% ] 0.84% | 1,031,186 | 11.2% |
[ 1.0% - 1.5% ] 1.05% | 1,084,666 | 11.1% |
[ 1.0% - 1.5% ] 1.21% | 351,698 | 13.6% |
[ 1.0% - 1.5% ] 1.39% | 86,092 | 14.8% |
[ 1.5% - 2.0% ] 1.64% | 136,944 | 11.2% |
[ 1.5% - 2.0% ] 1.79% | 97,454 | 14.0% |
[ 2.0% - 2.5% ] 2.01% | 69,723 | 12.9% |
[ 2.0% - 2.5% ] 2.15% | 37,651 | 17.6% |
[ 2.0% - 2.5% ] 2.33% | 35,304 | 2.0% |
[ 2.5% - 3.0% ] 2.57% | 153,853 | 10.1% |
[ 3.0% - 3.5% ] 3.48% | 6,495 | 6.3% |
[ 4.0% - 4.5% ] 4.35% | 8,785 | 50.6% |
[ 4.5% - 5.0% ] 4.76% | 21,657 | 21.9% |
[ 7.0% - 7.5% ] 7.03% | 17,094 | 32.4% |
[ 9.0% - 9.5% ] 9.08% | 16,358 | 18.1% |
[ 9.0% - 9.5% ] 9.21% | 29,286 | 8.3% |