Syrian Self-Care Disability
COMPARE
Syrian
Select to Compare
Self-Care Disability
Syrian Self-Care Disability
2.5%
SELF-CARE DISABILITY
59.0/ 100
METRIC RATING
165th/ 347
METRIC RANK
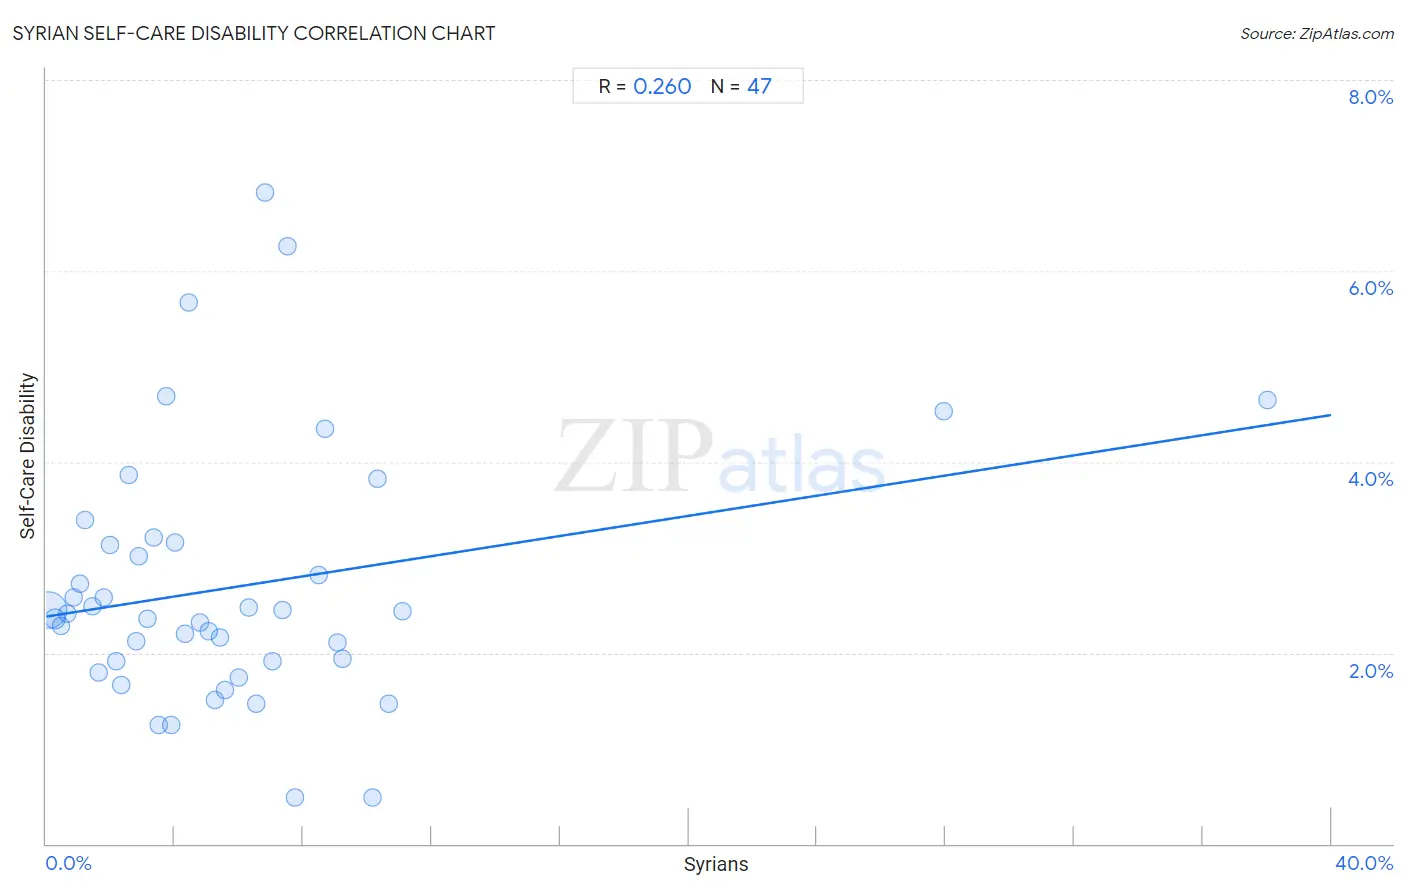
Syrian Self-Care Disability Correlation Chart
The statistical analysis conducted on geographies consisting of 266,133,932 people shows a weak positive correlation between the proportion of Syrians and percentage of population with self-care disability in the United States with a correlation coefficient (R) of 0.260 and weighted average of 2.5%. On average, for every 1% (one percent) increase in Syrians within a typical geography, there is an increase of 0.053% in percentage of population with self-care disability.
It is essential to understand that the correlation between the percentage of Syrians and percentage of population with self-care disability does not imply a direct cause-and-effect relationship. It remains uncertain whether the presence of Syrians influences an upward or downward trend in the level of percentage of population with self-care disability within an area, or if Syrians simply ended up residing in those areas with higher or lower levels of percentage of population with self-care disability due to other factors.
Demographics Similar to Syrians by Self-Care Disability
In terms of self-care disability, the demographic groups most similar to Syrians are Canadian (2.5%, a difference of 0.010%), Immigrants from Vietnam (2.5%, a difference of 0.020%), Immigrants from Greece (2.5%, a difference of 0.080%), Ute (2.5%, a difference of 0.090%), and Immigrants from Somalia (2.5%, a difference of 0.15%).
| Demographics | Rating | Rank | Self-Care Disability |
| Immigrants from Western Europe | 68.6 /100 | #158 | Good 2.4% |
| Immigrants from Italy | 68.5 /100 | #159 | Good 2.4% |
| Finns | 67.0 /100 | #160 | Good 2.4% |
| Lebanese | 66.5 /100 | #161 | Good 2.4% |
| Somalis | 63.7 /100 | #162 | Good 2.5% |
| German Russians | 62.7 /100 | #163 | Good 2.5% |
| Immigrants from Vietnam | 59.3 /100 | #164 | Average 2.5% |
| Syrians | 59.0 /100 | #165 | Average 2.5% |
| Canadians | 58.8 /100 | #166 | Average 2.5% |
| Immigrants from Greece | 57.3 /100 | #167 | Average 2.5% |
| Ute | 57.1 /100 | #168 | Average 2.5% |
| Immigrants from Somalia | 55.9 /100 | #169 | Average 2.5% |
| Scottish | 54.3 /100 | #170 | Average 2.5% |
| Pennsylvania Germans | 53.5 /100 | #171 | Average 2.5% |
| Czechoslovakians | 53.5 /100 | #172 | Average 2.5% |
Syrian Self-Care Disability Correlation Summary
| Measurement | Syrian Data | Self-Care Disability Data |
| Minimum | 0.066% | 0.49% |
| Maximum | 38.0% | 6.8% |
| Range | 37.9% | 6.3% |
| Mean | 5.9% | 2.7% |
| Median | 4.4% | 2.4% |
| Interquartile 25% (IQ1) | 2.2% | 1.9% |
| Interquartile 75% (IQ3) | 7.5% | 3.2% |
| Interquartile Range (IQR) | 5.3% | 1.3% |
| Standard Deviation (Sample) | 6.6% | 1.3% |
| Standard Deviation (Population) | 6.5% | 1.3% |
Correlation Details
| Syrian Percentile | Sample Size | Self-Care Disability |
[ 0.0% - 0.5% ] 0.066% | 223,365,319 | 2.5% |
[ 0.0% - 0.5% ] 0.27% | 26,299,679 | 2.4% |
[ 0.0% - 0.5% ] 0.46% | 7,475,557 | 2.3% |
[ 0.5% - 1.0% ] 0.65% | 3,637,796 | 2.4% |
[ 0.5% - 1.0% ] 0.84% | 1,703,209 | 2.6% |
[ 1.0% - 1.5% ] 1.05% | 1,524,547 | 2.7% |
[ 1.0% - 1.5% ] 1.22% | 641,747 | 3.4% |
[ 1.0% - 1.5% ] 1.44% | 399,610 | 2.5% |
[ 1.5% - 2.0% ] 1.62% | 220,820 | 1.8% |
[ 1.5% - 2.0% ] 1.79% | 140,165 | 2.6% |
[ 2.0% - 2.5% ] 2.00% | 135,024 | 3.1% |
[ 2.0% - 2.5% ] 2.17% | 95,846 | 1.9% |
[ 2.0% - 2.5% ] 2.34% | 56,007 | 1.7% |
[ 2.5% - 3.0% ] 2.57% | 171,560 | 3.9% |
[ 2.5% - 3.0% ] 2.79% | 13,781 | 2.1% |
[ 2.5% - 3.0% ] 2.87% | 29,166 | 3.0% |
[ 3.0% - 3.5% ] 3.15% | 6,422 | 2.4% |
[ 3.0% - 3.5% ] 3.33% | 23,897 | 3.2% |
[ 3.0% - 3.5% ] 3.49% | 18,640 | 1.2% |
[ 3.5% - 4.0% ] 3.73% | 6,415 | 4.7% |
[ 3.5% - 4.0% ] 3.90% | 1,052 | 1.2% |
[ 4.0% - 4.5% ] 4.01% | 17,575 | 3.2% |
[ 4.0% - 4.5% ] 4.34% | 9,569 | 2.2% |
[ 4.0% - 4.5% ] 4.42% | 814 | 5.7% |
[ 4.5% - 5.0% ] 4.77% | 43,607 | 2.3% |
[ 5.0% - 5.5% ] 5.07% | 1,125 | 2.2% |
[ 5.0% - 5.5% ] 5.24% | 1,106 | 1.5% |
[ 5.0% - 5.5% ] 5.39% | 2,651 | 2.2% |
[ 5.5% - 6.0% ] 5.57% | 6,377 | 1.6% |
[ 6.0% - 6.5% ] 6.01% | 5,007 | 1.7% |
[ 6.0% - 6.5% ] 6.32% | 1,551 | 2.5% |
[ 6.5% - 7.0% ] 6.53% | 2,022 | 1.5% |
[ 6.5% - 7.0% ] 6.82% | 44 | 6.8% |
[ 7.0% - 7.5% ] 7.03% | 17,094 | 1.9% |
[ 7.0% - 7.5% ] 7.34% | 2,699 | 2.4% |
[ 7.5% - 8.0% ] 7.51% | 852 | 6.3% |
[ 7.5% - 8.0% ] 7.76% | 438 | 0.49% |
[ 8.0% - 8.5% ] 8.50% | 412 | 2.8% |
[ 8.5% - 9.0% ] 8.68% | 645 | 4.3% |
[ 9.0% - 9.5% ] 9.08% | 16,358 | 2.1% |
[ 9.0% - 9.5% ] 9.21% | 29,286 | 1.9% |
[ 10.0% - 10.5% ] 10.14% | 2,998 | 0.49% |
[ 10.0% - 10.5% ] 10.30% | 728 | 3.8% |
[ 10.5% - 11.0% ] 10.67% | 1,097 | 1.5% |
[ 11.0% - 11.5% ] 11.08% | 2,960 | 2.4% |
[ 27.5% - 28.0% ] 27.95% | 508 | 4.5% |
[ 38.0% - 38.5% ] 38.00% | 150 | 4.7% |