Syrian 3 or more Vehicles in Household

COMPARE

Syrian
Race
Ancestry
AfghanAfricanAlaska NativeAlaskan AthabascanAlbanianAleutAlsatianAmericanApacheArabArapahoArgentineanArmenianAssyrian/Chaldean/SyriacAustralianAustrianBahamianBangladeshiBarbadianBasqueBelgianBelizeanBermudanBhutaneseBlackfeetBolivianBrazilianBritishBritish West IndianBulgarianBurmeseCajunCambodianCanadianCape VerdeanCarpatho RusynCelticCentral AmericanCentral American IndianCherokeeCheyenneChickasawChileanChineseChippewaChoctawColombianColvilleComancheCosta RicanCreeCreekCroatianCrowCubanCypriotCzechCzechoslovakianDanishDelawareDominicanDutchDutch West IndianEastern EuropeanEcuadorianEgyptianEnglishEstonianEthiopianEuropeanFijianFilipinoFinnishFrenchFrench American IndianFrench CanadianGermanGerman RussianGhanaianGreekGuamanian/ChamorroGuatemalanGuyaneseHaitianHmongHonduranHopiHoumaHungarianIcelanderIndian (Asian)IndonesianInupiatIranianIraqiIrishIroquoisIsraeliItalianJamaicanJapaneseJordanianKenyanKiowaKoreanLaotianLatvianLebaneseLiberianLithuanianLumbeeLuxembourgerMacedonianMalaysianMalteseMarshalleseMenomineeMexicanMexican American IndianMongolianMoroccanNative HawaiianNavajoNepaleseNew ZealanderNicaraguanNigerianNorthern EuropeanNorwegianOkinawanOsageOttawaPaiutePakistaniPalestinianPanamanianParaguayanPennsylvania GermanPeruvianPimaPolishPortuguesePotawatomiPuebloPuerto RicanPuget Sound SalishRomanianRussianSalvadoranSamoanScandinavianScotch-IrishScottishSeminoleSenegaleseSerbianShoshoneSierra LeoneanSiouxSlavicSlovakSloveneSomaliSouth AfricanSouth AmericanSouth American IndianSoviet UnionSpaniardSpanishSpanish AmericanSpanish American IndianSri LankanSubsaharan AfricanSudaneseSwedishSwissSyrianTaiwaneseThaiTlingit-HaidaTohono O'OdhamTonganTrinidadian and TobagonianTsimshianTurkishU.S. Virgin IslanderUgandanUkrainianUruguayanUteVenezuelanVietnameseWelshWest IndianYakamaYaquiYugoslavianYumanYup'ikZimbabwean
Immigration
NonimmigrantsImmigrantsAfghanistanAfricaAlbaniaArgentinaArmeniaAsiaAustraliaAustriaBahamasBangladeshBarbadosBelarusBelgiumBelizeBoliviaBosnia and HerzegovinaBrazilBulgariaBurma/MyanmarCabo VerdeCambodiaCameroonCanadaCaribbeanCentral AmericaChileChinaColombiaCongoCosta RicaCroatiaCubaCzechoslovakiaDenmarkDominicaDominican RepublicEastern AfricaEastern AsiaEastern EuropeEcuadorEgyptEl SalvadorEnglandEritreaEthiopiaEuropeFijiFranceGermanyGhanaGreeceGrenadaGuatemalaGuyanaHaitiHondurasHong KongHungaryIndiaIndonesiaIranIraqIrelandIsraelItalyJamaicaJapanJordanKazakhstanKenyaKoreaKuwaitLaosLatin AmericaLatviaLebanonLiberiaLithuaniaMalaysiaMexicoMicronesiaMiddle AfricaMoldovaMoroccoNepalNetherlandsNicaraguaNigeriaNorth AmericaNorth MacedoniaNorthern AfricaNorthern EuropeNorwayOceaniaPakistanPanamaPeruPhilippinesPolandPortugalRomaniaRussiaSaudi ArabiaScotlandSenegalSerbiaSierra LeoneSingaporeSomaliaSouth AfricaSouth AmericaSouth Central AsiaSouth Eastern AsiaSouthern EuropeSpainSri LankaSt. Vincent and the GrenadinesSudanSwedenSwitzerlandSyriaTaiwanThailandTrinidad and TobagoTurkeyUgandaUkraineUruguayUzbekistanVenezuelaVietnamWest IndiesWestern AfricaWestern AsiaWestern EuropeYemenZaireZimbabweAzores
Select to Compare
Race
Ancestry
AfghanAfricanAlaska NativeAlaskan AthabascanAlbanianAleutAlsatianAmericanApacheArabArapahoArgentineanArmenianAssyrian/Chaldean/SyriacAustralianAustrianBahamianBangladeshiBarbadianBasqueBelgianBelizeanBermudanBhutaneseBlackfeetBolivianBrazilianBritishBritish West IndianBulgarianBurmeseCajunCambodianCanadianCape VerdeanCarpatho RusynCelticCentral AmericanCentral American IndianCherokeeCheyenneChickasawChileanChineseChippewaChoctawColombianColvilleComancheCosta RicanCreeCreekCroatianCrowCubanCypriotCzechCzechoslovakianDanishDelawareDominicanDutchDutch West IndianEastern EuropeanEcuadorianEgyptianEnglishEstonianEthiopianEuropeanFijianFilipinoFinnishFrenchFrench American IndianFrench CanadianGermanGerman RussianGhanaianGreekGuamanian/ChamorroGuatemalanGuyaneseHaitianHmongHonduranHopiHoumaHungarianIcelanderIndian (Asian)IndonesianInupiatIranianIraqiIrishIroquoisIsraeliItalianJamaicanJapaneseJordanianKenyanKiowaKoreanLaotianLatvianLebaneseLiberianLithuanianLumbeeLuxembourgerMacedonianMalaysianMalteseMarshalleseMenomineeMexicanMexican American IndianMongolianMoroccanNative HawaiianNavajoNepaleseNew ZealanderNicaraguanNigerianNorthern EuropeanNorwegianOkinawanOsageOttawaPaiutePakistaniPalestinianPanamanianParaguayanPennsylvania GermanPeruvianPimaPolishPortuguesePotawatomiPuebloPuerto RicanPuget Sound SalishRomanianRussianSalvadoranSamoanScandinavianScotch-IrishScottishSeminoleSenegaleseSerbianShoshoneSierra LeoneanSiouxSlavicSlovakSloveneSomaliSouth AfricanSouth AmericanSouth American IndianSoviet UnionSpaniardSpanishSpanish AmericanSpanish American IndianSri LankanSubsaharan AfricanSudaneseSwedishSwissTaiwaneseThaiTlingit-HaidaTohono O'OdhamTonganTrinidadian and TobagonianTsimshianTurkishU.S. Virgin IslanderUgandanUkrainianUruguayanUteVenezuelanVietnameseWelshWest IndianYakamaYaquiYugoslavianYumanYup'ikZimbabwean
Immigration
NonimmigrantsImmigrantsAfghanistanAfricaAlbaniaArgentinaArmeniaAsiaAustraliaAustriaBahamasBangladeshBarbadosBelarusBelgiumBelizeBoliviaBosnia and HerzegovinaBrazilBulgariaBurma/MyanmarCabo VerdeCambodiaCameroonCanadaCaribbeanCentral AmericaChileChinaColombiaCongoCosta RicaCroatiaCubaCzechoslovakiaDenmarkDominicaDominican RepublicEastern AfricaEastern AsiaEastern EuropeEcuadorEgyptEl SalvadorEnglandEritreaEthiopiaEuropeFijiFranceGermanyGhanaGreeceGrenadaGuatemalaGuyanaHaitiHondurasHong KongHungaryIndiaIndonesiaIranIraqIrelandIsraelItalyJamaicaJapanJordanKazakhstanKenyaKoreaKuwaitLaosLatin AmericaLatviaLebanonLiberiaLithuaniaMalaysiaMexicoMicronesiaMiddle AfricaMoldovaMoroccoNepalNetherlandsNicaraguaNigeriaNorth AmericaNorth MacedoniaNorthern AfricaNorthern EuropeNorwayOceaniaPakistanPanamaPeruPhilippinesPolandPortugalRomaniaRussiaSaudi ArabiaScotlandSenegalSerbiaSierra LeoneSingaporeSomaliaSouth AfricaSouth AmericaSouth Central AsiaSouth Eastern AsiaSouthern EuropeSpainSri LankaSt. Vincent and the GrenadinesSudanSwedenSwitzerlandSyriaTaiwanThailandTrinidad and TobagoTurkeyUgandaUkraineUruguayUzbekistanVenezuelaVietnamWest IndiesWestern AfricaWestern AsiaWestern EuropeYemenZaireZimbabweAzores
3 or more Vehicles in Household
Income
Poverty
Unemployment
Labor Participation
Family Structure
Vehicle Availability
Education Level
Disability

Syrian 3 or more Vehicles in Household
Average

19.5%
3+ VEHICLES AVAILABLE
47.0/ 100
METRIC RATING
175th/ 347
METRIC RANK

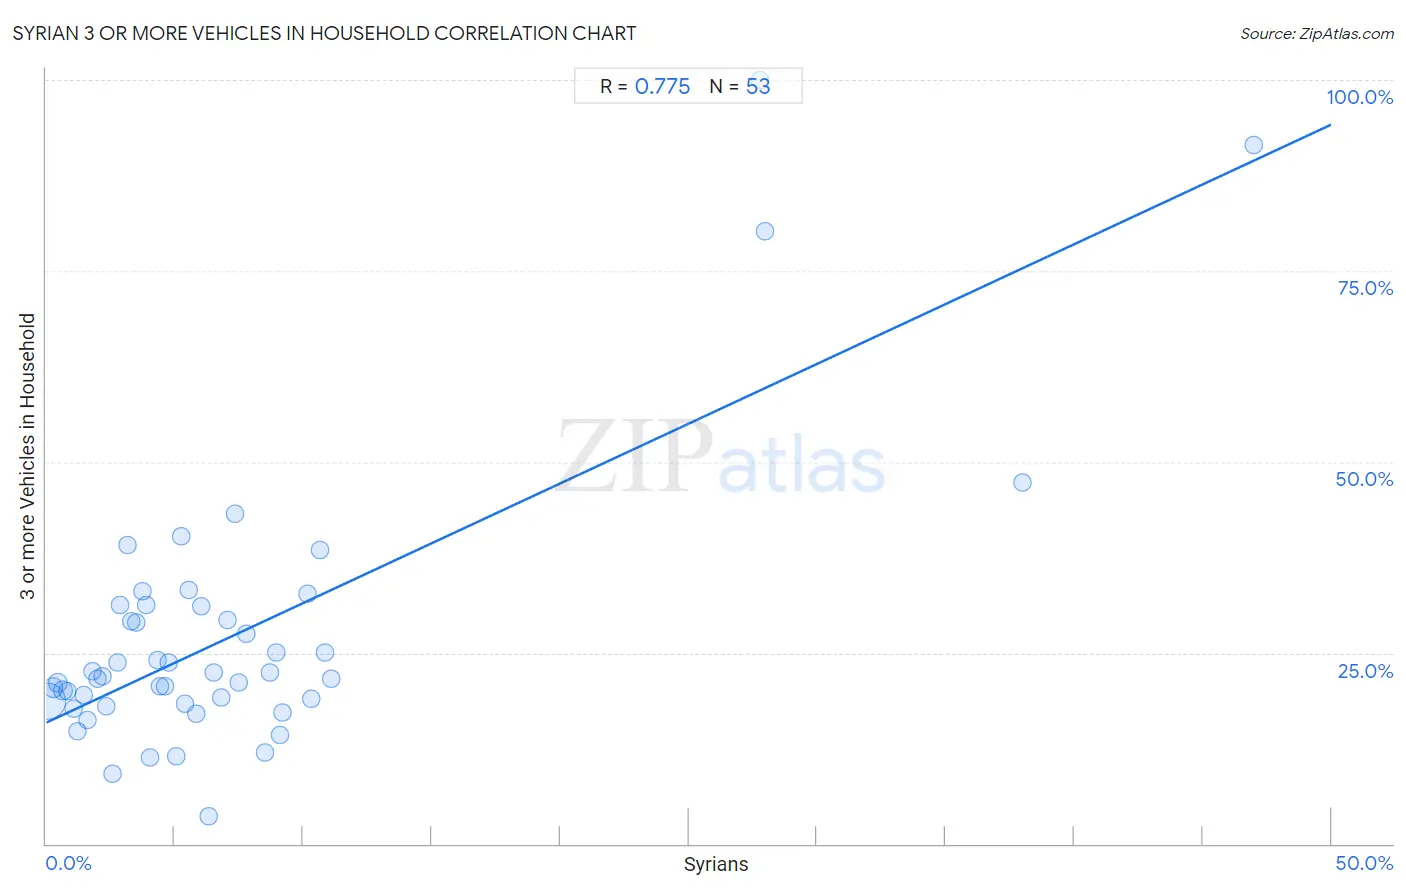
Syrian 3 or more Vehicles in Household Correlation Chart

The statistical analysis conducted on geographies consisting of 266,128,737 people shows a strong positive correlation between the proportion of Syrians and percentage of households with 3 or more vehicles available in the United States with a correlation coefficient (R) of 0.775 and weighted average of 19.5%. On average, for every 1% (one percent) increase in Syrians within a typical geography, there is an increase of 1.6% in percentage of households with 3 or more vehicles available.
Syrian 3 or more Vehicles in Household
It is essential to understand that the correlation between the percentage of Syrians and percentage of households with 3 or more vehicles available does not imply a direct cause-and-effect relationship. It remains uncertain whether the presence of Syrians influences an upward or downward trend in the level of percentage of households with 3 or more vehicles available within an area, or if Syrians simply ended up residing in those areas with higher or lower levels of percentage of households with 3 or more vehicles available due to other factors.

Demographics Similar to Syrians by 3 or more Vehicles in Household

In terms of 3 or more vehicles in household, the demographic groups most similar to Syrians are Iroquois (19.4%, a difference of 0.070%), Immigrants from South Africa (19.5%, a difference of 0.23%), Immigrants from Northern Europe (19.5%, a difference of 0.25%), Kiowa (19.5%, a difference of 0.30%), and Immigrants from Peru (19.4%, a difference of 0.45%).
DemographicsRating | Rank3 or more Vehicles in Household
Peruvians
58.8
/100
|
#168
Average
19.6%
Immigrants from Denmark
57.6
/100
|
#169
Average
19.6%
Iraqis
56.0
/100
|
#170
Average
19.6%
Immigrants from Western Europe
53.2
/100
|
#171
Average
19.5%
Kiowa
50.9
/100
|
#172
Average
19.5%
Immigrants from Northern Europe
50.2
/100
|
#173
Average
19.5%
Immigrants from South Africa
50.0
/100
|
#174
Average
19.5%
Syrians
47.0
/100
|
#175
Average
19.5%
Iroquois
46.0
/100
|
#176
Average
19.4%
Immigrants from Peru
41.1
/100
|
#177
Average
19.4%
Immigrants from Syria
40.3
/100
|
#178
Average
19.4%
Immigrants from South Central Asia
38.9
/100
|
#179
Fair
19.3%
South Africans
37.5
/100
|
#180
Fair
19.3%
Romanians
37.1
/100
|
#181
Fair
19.3%
Cubans
36.6
/100
|
#182
Fair
19.3%

Syrian 3 or more Vehicles in Household Correlation Summary

MeasurementSyrian Data3 or more Vehicles in Household Data
Minimum0.066%3.6%
Maximum47.0%100.0%
Range46.9%96.4%
Mean7.3%27.2%
Median5.1%22.0%
Interquartile 25% (IQ1)2.5%18.5%
Interquartile 75% (IQ3)8.6%31.2%
Interquartile Range (IQR)6.1%12.6%
Standard Deviation (Sample)8.9%18.0%
Standard Deviation (Population)8.8%17.8%

Correlation Details

Syrian PercentileSample Size3 or more Vehicles in Household
[
0.0%
-
0.5%
]
0.066%
223,371,29518.7%
[
0.0%
-
0.5%
]
0.27%
26,278,26820.4%
[
0.0%
-
0.5%
]
0.46%
7,475,50221.0%
[
0.5%
-
1.0%
]
0.65%
3,637,00120.1%
[
0.5%
-
1.0%
]
0.84%
1,702,83120.0%
[
1.0%
-
1.5%
]
1.05%
1,524,28917.6%
[
1.0%
-
1.5%
]
1.22%
644,09214.7%
[
1.0%
-
1.5%
]
1.44%
400,99019.5%
[
1.5%
-
2.0%
]
1.63%
215,60316.3%
[
1.5%
-
2.0%
]
1.79%
140,01222.6%
[
2.0%
-
2.5%
]
2.00%
135,85821.6%
[
2.0%
-
2.5%
]
2.17%
96,17022.0%
[
2.0%
-
2.5%
]
2.34%
58,90218.0%
[
2.5%
-
3.0%
]
2.57%
173,0329.1%
[
2.5%
-
3.0%
]
2.79%
13,78123.7%
[
2.5%
-
3.0%
]
2.87%
29,71431.3%
[
3.0%
-
3.5%
]
3.14%
6,55239.2%
[
3.0%
-
3.5%
]
3.33%
24,47729.2%
[
3.0%
-
3.5%
]
3.49%
19,62528.9%
[
3.5%
-
4.0%
]
3.73%
6,41533.0%
[
3.5%
-
4.0%
]
3.88%
1,34131.3%
[
4.0%
-
4.5%
]
4.01%
18,51611.2%
[
4.0%
-
4.5%
]
4.33%
12,53324.1%
[
4.0%
-
4.5%
]
4.42%
81420.6%
[
4.5%
-
5.0%
]
4.60%
26120.6%
[
4.5%
-
5.0%
]
4.77%
43,60723.8%
[
5.0%
-
5.5%
]
5.07%
1,12511.4%
[
5.0%
-
5.5%
]
5.25%
1,23840.2%
[
5.0%
-
5.5%
]
5.39%
2,65118.3%
[
5.5%
-
6.0%
]
5.57%
6,37733.2%
[
5.5%
-
6.0%
]
5.82%
18917.0%
[
6.0%
-
6.5%
]
6.01%
5,00731.0%
[
6.0%
-
6.5%
]
6.32%
1,5513.6%
[
6.5%
-
7.0%
]
6.53%
2,02222.4%
[
6.5%
-
7.0%
]
6.82%
4419.2%
[
7.0%
-
7.5%
]
7.03%
17,25029.3%
[
7.0%
-
7.5%
]
7.34%
2,69943.3%
[
7.5%
-
8.0%
]
7.51%
85221.1%
[
7.5%
-
8.0%
]
7.76%
43827.5%
[
8.0%
-
8.5%
]
8.50%
41212.0%
[
8.5%
-
9.0%
]
8.68%
64522.5%
[
8.5%
-
9.0%
]
8.93%
5625.0%
[
9.0%
-
9.5%
]
9.08%
16,35814.3%
[
9.0%
-
9.5%
]
9.21%
29,28617.2%
[
10.0%
-
10.5%
]
10.14%
3,32332.8%
[
10.0%
-
10.5%
]
10.30%
72818.9%
[
10.5%
-
11.0%
]
10.67%
1,09738.5%
[
10.5%
-
11.0%
]
10.84%
8325.0%
[
11.0%
-
11.5%
]
11.08%
2,96021.6%
[
27.5%
-
28.0%
]
27.78%
90100.0%
[
27.5%
-
28.0%
]
27.95%
50880.2%
[
38.0%
-
38.5%
]
38.00%
15047.4%
[
47.0%
-
47.5%
]
47.01%
11791.4%