Syrian Male Disability

COMPARE

Syrian
Race
Ancestry
AfghanAfricanAlaska NativeAlaskan AthabascanAlbanianAleutAlsatianAmericanApacheArabArapahoArgentineanArmenianAssyrian/Chaldean/SyriacAustralianAustrianBahamianBangladeshiBarbadianBasqueBelgianBelizeanBermudanBhutaneseBlackfeetBolivianBrazilianBritishBritish West IndianBulgarianBurmeseCajunCambodianCanadianCape VerdeanCarpatho RusynCelticCentral AmericanCentral American IndianCherokeeCheyenneChickasawChileanChineseChippewaChoctawColombianColvilleComancheCosta RicanCreeCreekCroatianCrowCubanCypriotCzechCzechoslovakianDanishDelawareDominicanDutchDutch West IndianEastern EuropeanEcuadorianEgyptianEnglishEstonianEthiopianEuropeanFijianFilipinoFinnishFrenchFrench American IndianFrench CanadianGermanGerman RussianGhanaianGreekGuamanian/ChamorroGuatemalanGuyaneseHaitianHmongHonduranHopiHoumaHungarianIcelanderIndian (Asian)IndonesianInupiatIranianIraqiIrishIroquoisIsraeliItalianJamaicanJapaneseJordanianKenyanKiowaKoreanLaotianLatvianLebaneseLiberianLithuanianLumbeeLuxembourgerMacedonianMalaysianMalteseMarshalleseMenomineeMexicanMexican American IndianMongolianMoroccanNative HawaiianNavajoNepaleseNew ZealanderNicaraguanNigerianNorthern EuropeanNorwegianOkinawanOsageOttawaPaiutePakistaniPalestinianPanamanianParaguayanPennsylvania GermanPeruvianPimaPolishPortuguesePotawatomiPuebloPuerto RicanPuget Sound SalishRomanianRussianSalvadoranSamoanScandinavianScotch-IrishScottishSeminoleSenegaleseSerbianShoshoneSierra LeoneanSiouxSlavicSlovakSloveneSomaliSouth AfricanSouth AmericanSouth American IndianSoviet UnionSpaniardSpanishSpanish AmericanSpanish American IndianSri LankanSubsaharan AfricanSudaneseSwedishSwissSyrianTaiwaneseThaiTlingit-HaidaTohono O'OdhamTonganTrinidadian and TobagonianTsimshianTurkishU.S. Virgin IslanderUgandanUkrainianUruguayanUteVenezuelanVietnameseWelshWest IndianYakamaYaquiYugoslavianYumanYup'ikZimbabwean
Immigration
NonimmigrantsImmigrantsAfghanistanAfricaAlbaniaArgentinaArmeniaAsiaAustraliaAustriaBahamasBangladeshBarbadosBelarusBelgiumBelizeBoliviaBosnia and HerzegovinaBrazilBulgariaBurma/MyanmarCabo VerdeCambodiaCameroonCanadaCaribbeanCentral AmericaChileChinaColombiaCongoCosta RicaCroatiaCubaCzechoslovakiaDenmarkDominicaDominican RepublicEastern AfricaEastern AsiaEastern EuropeEcuadorEgyptEl SalvadorEnglandEritreaEthiopiaEuropeFijiFranceGermanyGhanaGreeceGrenadaGuatemalaGuyanaHaitiHondurasHong KongHungaryIndiaIndonesiaIranIraqIrelandIsraelItalyJamaicaJapanJordanKazakhstanKenyaKoreaKuwaitLaosLatin AmericaLatviaLebanonLiberiaLithuaniaMalaysiaMexicoMicronesiaMiddle AfricaMoldovaMoroccoNepalNetherlandsNicaraguaNigeriaNorth AmericaNorth MacedoniaNorthern AfricaNorthern EuropeNorwayOceaniaPakistanPanamaPeruPhilippinesPolandPortugalRomaniaRussiaSaudi ArabiaScotlandSenegalSerbiaSierra LeoneSingaporeSomaliaSouth AfricaSouth AmericaSouth Central AsiaSouth Eastern AsiaSouthern EuropeSpainSri LankaSt. Vincent and the GrenadinesSudanSwedenSwitzerlandSyriaTaiwanThailandTrinidad and TobagoTurkeyUgandaUkraineUruguayUzbekistanVenezuelaVietnamWest IndiesWestern AfricaWestern AsiaWestern EuropeYemenZaireZimbabweAzores
Select to Compare
Race
Ancestry
AfghanAfricanAlaska NativeAlaskan AthabascanAlbanianAleutAlsatianAmericanApacheArabArapahoArgentineanArmenianAssyrian/Chaldean/SyriacAustralianAustrianBahamianBangladeshiBarbadianBasqueBelgianBelizeanBermudanBhutaneseBlackfeetBolivianBrazilianBritishBritish West IndianBulgarianBurmeseCajunCambodianCanadianCape VerdeanCarpatho RusynCelticCentral AmericanCentral American IndianCherokeeCheyenneChickasawChileanChineseChippewaChoctawColombianColvilleComancheCosta RicanCreeCreekCroatianCrowCubanCypriotCzechCzechoslovakianDanishDelawareDominicanDutchDutch West IndianEastern EuropeanEcuadorianEgyptianEnglishEstonianEthiopianEuropeanFijianFilipinoFinnishFrenchFrench American IndianFrench CanadianGermanGerman RussianGhanaianGreekGuamanian/ChamorroGuatemalanGuyaneseHaitianHmongHonduranHopiHoumaHungarianIcelanderIndian (Asian)IndonesianInupiatIranianIraqiIrishIroquoisIsraeliItalianJamaicanJapaneseJordanianKenyanKiowaKoreanLaotianLatvianLebaneseLiberianLithuanianLumbeeLuxembourgerMacedonianMalaysianMalteseMarshalleseMenomineeMexicanMexican American IndianMongolianMoroccanNative HawaiianNavajoNepaleseNew ZealanderNicaraguanNigerianNorthern EuropeanNorwegianOkinawanOsageOttawaPaiutePakistaniPalestinianPanamanianParaguayanPennsylvania GermanPeruvianPimaPolishPortuguesePotawatomiPuebloPuerto RicanPuget Sound SalishRomanianRussianSalvadoranSamoanScandinavianScotch-IrishScottishSeminoleSenegaleseSerbianShoshoneSierra LeoneanSiouxSlavicSlovakSloveneSomaliSouth AfricanSouth AmericanSouth American IndianSoviet UnionSpaniardSpanishSpanish AmericanSpanish American IndianSri LankanSubsaharan AfricanSudaneseSwedishSwissTaiwaneseThaiTlingit-HaidaTohono O'OdhamTonganTrinidadian and TobagonianTsimshianTurkishU.S. Virgin IslanderUgandanUkrainianUruguayanUteVenezuelanVietnameseWelshWest IndianYakamaYaquiYugoslavianYumanYup'ikZimbabwean
Immigration
NonimmigrantsImmigrantsAfghanistanAfricaAlbaniaArgentinaArmeniaAsiaAustraliaAustriaBahamasBangladeshBarbadosBelarusBelgiumBelizeBoliviaBosnia and HerzegovinaBrazilBulgariaBurma/MyanmarCabo VerdeCambodiaCameroonCanadaCaribbeanCentral AmericaChileChinaColombiaCongoCosta RicaCroatiaCubaCzechoslovakiaDenmarkDominicaDominican RepublicEastern AfricaEastern AsiaEastern EuropeEcuadorEgyptEl SalvadorEnglandEritreaEthiopiaEuropeFijiFranceGermanyGhanaGreeceGrenadaGuatemalaGuyanaHaitiHondurasHong KongHungaryIndiaIndonesiaIranIraqIrelandIsraelItalyJamaicaJapanJordanKazakhstanKenyaKoreaKuwaitLaosLatin AmericaLatviaLebanonLiberiaLithuaniaMalaysiaMexicoMicronesiaMiddle AfricaMoldovaMoroccoNepalNetherlandsNicaraguaNigeriaNorth AmericaNorth MacedoniaNorthern AfricaNorthern EuropeNorwayOceaniaPakistanPanamaPeruPhilippinesPolandPortugalRomaniaRussiaSaudi ArabiaScotlandSenegalSerbiaSierra LeoneSingaporeSomaliaSouth AfricaSouth AmericaSouth Central AsiaSouth Eastern AsiaSouthern EuropeSpainSri LankaSt. Vincent and the GrenadinesSudanSwedenSwitzerlandSyriaTaiwanThailandTrinidad and TobagoTurkeyUgandaUkraineUruguayUzbekistanVenezuelaVietnamWest IndiesWestern AfricaWestern AsiaWestern EuropeYemenZaireZimbabweAzores
Male Disability
Income
Poverty
Unemployment
Labor Participation
Family Structure
Vehicle Availability
Education Level
Disability

Syrian Male Disability
Average

11.2%
DISABILITY | MALES
46.6/ 100
METRIC RATING
176th/ 347
METRIC RANK

Syrian Male Disability Correlation Chart

The statistical analysis conducted on geographies consisting of 266,314,155 people shows a weak negative correlation between the proportion of Syrians and percentage of males with a disability in the United States with a correlation coefficient (R) of -0.275 and weighted average of 11.2%. On average, for every 1% (one percent) increase in Syrians within a typical geography, there is a decrease of 0.14% in percentage of males with a disability.
Syrian Male Disability
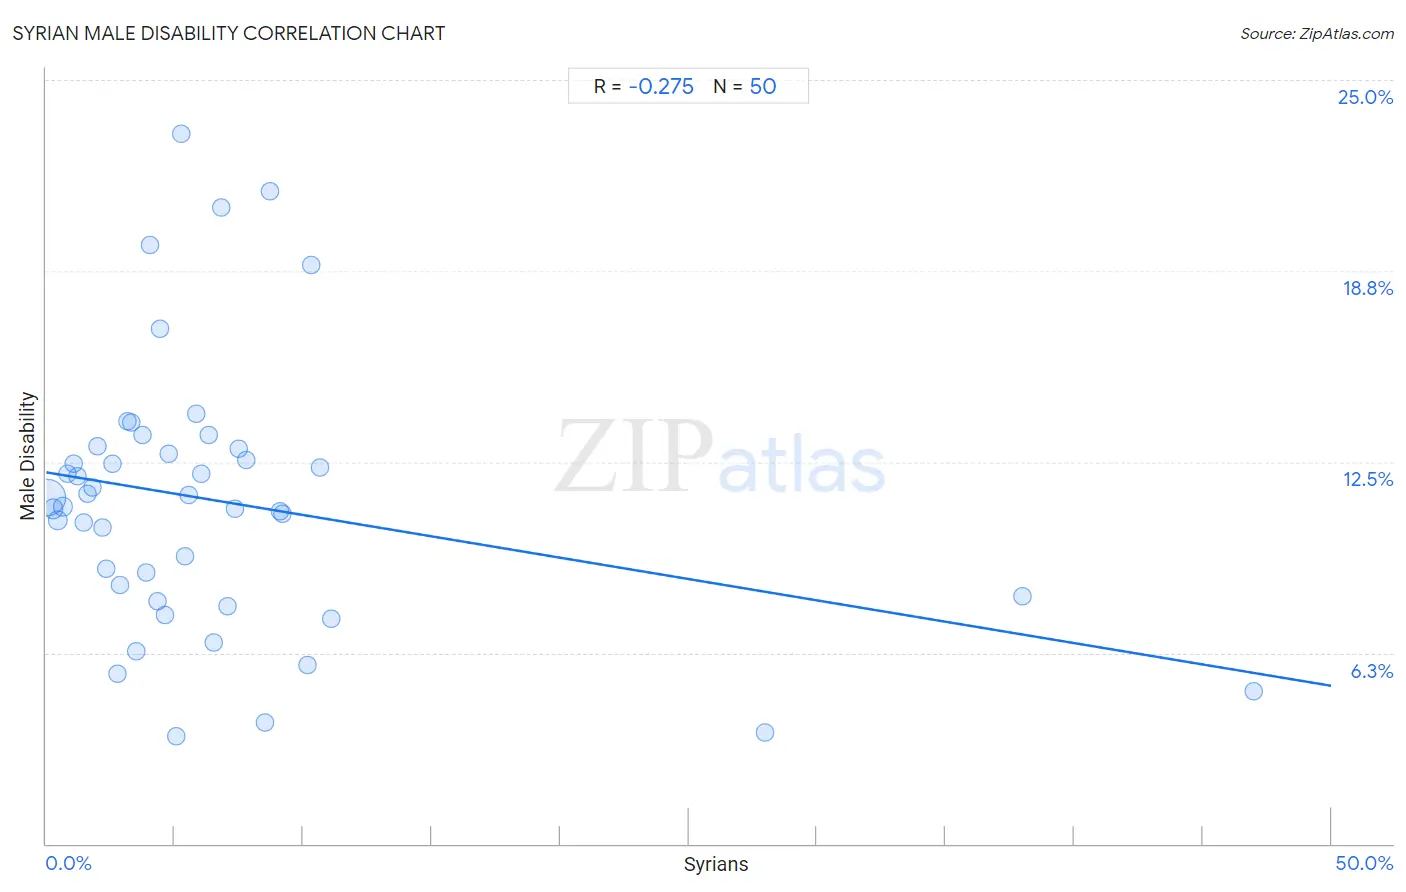
It is essential to understand that the correlation between the percentage of Syrians and percentage of males with a disability does not imply a direct cause-and-effect relationship. It remains uncertain whether the presence of Syrians influences an upward or downward trend in the level of percentage of males with a disability within an area, or if Syrians simply ended up residing in those areas with higher or lower levels of percentage of males with a disability due to other factors.

Demographics Similar to Syrians by Male Disability

In terms of male disability, the demographic groups most similar to Syrians are Immigrants from Honduras (11.2%, a difference of 0.12%), Immigrants from Norway (11.3%, a difference of 0.13%), Maltese (11.2%, a difference of 0.19%), Immigrants from Burma/Myanmar (11.2%, a difference of 0.21%), and Romanian (11.2%, a difference of 0.23%).
DemographicsRating | RankMale Disability
Barbadians
53.4
/100
|
#169
Average
11.2%
New Zealanders
52.9
/100
|
#170
Average
11.2%
Haitians
52.5
/100
|
#171
Average
11.2%
Romanians
50.7
/100
|
#172
Average
11.2%
Immigrants from Burma/Myanmar
50.4
/100
|
#173
Average
11.2%
Maltese
50.0
/100
|
#174
Average
11.2%
Immigrants from Honduras
48.7
/100
|
#175
Average
11.2%
Syrians
46.6
/100
|
#176
Average
11.2%
Immigrants from Norway
44.2
/100
|
#177
Average
11.3%
Australians
42.2
/100
|
#178
Average
11.3%
Immigrants from Caribbean
41.4
/100
|
#179
Average
11.3%
Hondurans
41.1
/100
|
#180
Average
11.3%
Immigrants from Senegal
34.4
/100
|
#181
Fair
11.3%
Immigrants from Belize
33.7
/100
|
#182
Fair
11.3%
Immigrants from Central America
32.9
/100
|
#183
Fair
11.3%

Syrian Male Disability Correlation Summary

MeasurementSyrian DataMale Disability Data
Minimum0.066%3.5%
Maximum47.0%23.2%
Range46.9%19.7%
Mean6.7%11.2%
Median4.7%11.2%
Interquartile 25% (IQ1)2.3%8.1%
Interquartile 75% (IQ3)7.5%12.9%
Interquartile Range (IQR)5.2%4.8%
Standard Deviation (Sample)8.7%4.4%
Standard Deviation (Population)8.6%4.4%

Correlation Details

Syrian PercentileSample SizeMale Disability
[
0.0%
-
0.5%
]
0.066%
223,464,01611.3%
[
0.0%
-
0.5%
]
0.27%
26,327,64011.0%
[
0.0%
-
0.5%
]
0.46%
7,487,59510.6%
[
0.5%
-
1.0%
]
0.65%
3,645,99111.0%
[
0.5%
-
1.0%
]
0.84%
1,708,47012.1%
[
1.0%
-
1.5%
]
1.05%
1,526,65712.5%
[
1.0%
-
1.5%
]
1.22%
644,09212.0%
[
1.0%
-
1.5%
]
1.44%
400,99010.5%
[
1.5%
-
2.0%
]
1.62%
230,17411.4%
[
1.5%
-
2.0%
]
1.79%
140,73911.7%
[
2.0%
-
2.5%
]
2.00%
135,02413.0%
[
2.0%
-
2.5%
]
2.17%
96,17010.4%
[
2.0%
-
2.5%
]
2.34%
58,9029.0%
[
2.5%
-
3.0%
]
2.57%
173,03212.4%
[
2.5%
-
3.0%
]
2.79%
13,7815.6%
[
2.5%
-
3.0%
]
2.87%
29,7148.5%
[
3.0%
-
3.5%
]
3.14%
6,55213.8%
[
3.0%
-
3.5%
]
3.33%
24,47713.8%
[
3.0%
-
3.5%
]
3.49%
19,6256.3%
[
3.5%
-
4.0%
]
3.73%
6,41513.4%
[
3.5%
-
4.0%
]
3.88%
1,3418.9%
[
4.0%
-
4.5%
]
4.01%
18,51619.6%
[
4.0%
-
4.5%
]
4.33%
12,5337.9%
[
4.0%
-
4.5%
]
4.42%
81416.9%
[
4.5%
-
5.0%
]
4.60%
2617.5%
[
4.5%
-
5.0%
]
4.77%
43,60712.8%
[
5.0%
-
5.5%
]
5.07%
1,1253.5%
[
5.0%
-
5.5%
]
5.25%
1,23823.2%
[
5.0%
-
5.5%
]
5.39%
2,6519.4%
[
5.5%
-
6.0%
]
5.57%
6,37711.4%
[
5.5%
-
6.0%
]
5.82%
18914.1%
[
6.0%
-
6.5%
]
6.01%
5,00712.1%
[
6.0%
-
6.5%
]
6.32%
1,55113.4%
[
6.5%
-
7.0%
]
6.53%
2,0226.6%
[
6.5%
-
7.0%
]
6.82%
4420.8%
[
7.0%
-
7.5%
]
7.03%
17,2507.8%
[
7.0%
-
7.5%
]
7.34%
2,69911.0%
[
7.5%
-
8.0%
]
7.51%
85212.9%
[
7.5%
-
8.0%
]
7.76%
43812.5%
[
8.0%
-
8.5%
]
8.50%
4124.0%
[
8.5%
-
9.0%
]
8.68%
64521.4%
[
9.0%
-
9.5%
]
9.08%
16,35810.9%
[
9.0%
-
9.5%
]
9.21%
29,28610.8%
[
10.0%
-
10.5%
]
10.14%
3,3235.9%
[
10.0%
-
10.5%
]
10.30%
72818.9%
[
10.5%
-
11.0%
]
10.67%
1,09712.3%
[
11.0%
-
11.5%
]
11.08%
2,9607.4%
[
27.5%
-
28.0%
]
27.95%
5083.6%
[
38.0%
-
38.5%
]
38.00%
1508.1%
[
47.0%
-
47.5%
]
47.01%
1175.0%