Syrian Receiving Food Stamps

COMPARE

Syrian
Race
Ancestry
AfghanAfricanAlaska NativeAlaskan AthabascanAlbanianAleutAlsatianAmericanApacheArabArapahoArgentineanArmenianAssyrian/Chaldean/SyriacAustralianAustrianBahamianBangladeshiBarbadianBasqueBelgianBelizeanBermudanBhutaneseBlackfeetBolivianBrazilianBritishBritish West IndianBulgarianBurmeseCajunCambodianCanadianCape VerdeanCarpatho RusynCelticCentral AmericanCentral American IndianCherokeeCheyenneChickasawChileanChineseChippewaChoctawColombianColvilleComancheCosta RicanCreeCreekCroatianCrowCubanCypriotCzechCzechoslovakianDanishDelawareDominicanDutchDutch West IndianEastern EuropeanEcuadorianEgyptianEnglishEstonianEthiopianEuropeanFijianFilipinoFinnishFrenchFrench American IndianFrench CanadianGermanGerman RussianGhanaianGreekGuamanian/ChamorroGuatemalanGuyaneseHaitianHmongHonduranHopiHoumaHungarianIcelanderIndian (Asian)IndonesianInupiatIranianIraqiIrishIroquoisIsraeliItalianJamaicanJapaneseJordanianKenyanKiowaKoreanLaotianLatvianLebaneseLiberianLithuanianLumbeeLuxembourgerMacedonianMalaysianMalteseMarshalleseMenomineeMexicanMexican American IndianMongolianMoroccanNative HawaiianNavajoNepaleseNew ZealanderNicaraguanNigerianNorthern EuropeanNorwegianOkinawanOsageOttawaPaiutePakistaniPalestinianPanamanianParaguayanPennsylvania GermanPeruvianPimaPolishPortuguesePotawatomiPuebloPuerto RicanPuget Sound SalishRomanianRussianSalvadoranSamoanScandinavianScotch-IrishScottishSeminoleSenegaleseSerbianShoshoneSierra LeoneanSiouxSlavicSlovakSloveneSomaliSouth AfricanSouth AmericanSouth American IndianSoviet UnionSpaniardSpanishSpanish AmericanSpanish American IndianSri LankanSubsaharan AfricanSudaneseSwedishSwissSyrianTaiwaneseThaiTlingit-HaidaTohono O'OdhamTonganTrinidadian and TobagonianTsimshianTurkishU.S. Virgin IslanderUgandanUkrainianUruguayanUteVenezuelanVietnameseWelshWest IndianYakamaYaquiYugoslavianYumanYup'ikZimbabwean
Immigration
NonimmigrantsImmigrantsAfghanistanAfricaAlbaniaArgentinaArmeniaAsiaAustraliaAustriaBahamasBangladeshBarbadosBelarusBelgiumBelizeBoliviaBosnia and HerzegovinaBrazilBulgariaBurma/MyanmarCabo VerdeCambodiaCameroonCanadaCaribbeanCentral AmericaChileChinaColombiaCongoCosta RicaCroatiaCubaCzechoslovakiaDenmarkDominicaDominican RepublicEastern AfricaEastern AsiaEastern EuropeEcuadorEgyptEl SalvadorEnglandEritreaEthiopiaEuropeFijiFranceGermanyGhanaGreeceGrenadaGuatemalaGuyanaHaitiHondurasHong KongHungaryIndiaIndonesiaIranIraqIrelandIsraelItalyJamaicaJapanJordanKazakhstanKenyaKoreaKuwaitLaosLatin AmericaLatviaLebanonLiberiaLithuaniaMalaysiaMexicoMicronesiaMiddle AfricaMoldovaMoroccoNepalNetherlandsNicaraguaNigeriaNorth AmericaNorth MacedoniaNorthern AfricaNorthern EuropeNorwayOceaniaPakistanPanamaPeruPhilippinesPolandPortugalRomaniaRussiaSaudi ArabiaScotlandSenegalSerbiaSierra LeoneSingaporeSomaliaSouth AfricaSouth AmericaSouth Central AsiaSouth Eastern AsiaSouthern EuropeSpainSri LankaSt. Vincent and the GrenadinesSudanSwedenSwitzerlandSyriaTaiwanThailandTrinidad and TobagoTurkeyUgandaUkraineUruguayUzbekistanVenezuelaVietnamWest IndiesWestern AfricaWestern AsiaWestern EuropeYemenZaireZimbabweAzores
Select to Compare
Race
Ancestry
AfghanAfricanAlaska NativeAlaskan AthabascanAlbanianAleutAlsatianAmericanApacheArabArapahoArgentineanArmenianAssyrian/Chaldean/SyriacAustralianAustrianBahamianBangladeshiBarbadianBasqueBelgianBelizeanBermudanBhutaneseBlackfeetBolivianBrazilianBritishBritish West IndianBulgarianBurmeseCajunCambodianCanadianCape VerdeanCarpatho RusynCelticCentral AmericanCentral American IndianCherokeeCheyenneChickasawChileanChineseChippewaChoctawColombianColvilleComancheCosta RicanCreeCreekCroatianCrowCubanCypriotCzechCzechoslovakianDanishDelawareDominicanDutchDutch West IndianEastern EuropeanEcuadorianEgyptianEnglishEstonianEthiopianEuropeanFijianFilipinoFinnishFrenchFrench American IndianFrench CanadianGermanGerman RussianGhanaianGreekGuamanian/ChamorroGuatemalanGuyaneseHaitianHmongHonduranHopiHoumaHungarianIcelanderIndian (Asian)IndonesianInupiatIranianIraqiIrishIroquoisIsraeliItalianJamaicanJapaneseJordanianKenyanKiowaKoreanLaotianLatvianLebaneseLiberianLithuanianLumbeeLuxembourgerMacedonianMalaysianMalteseMarshalleseMenomineeMexicanMexican American IndianMongolianMoroccanNative HawaiianNavajoNepaleseNew ZealanderNicaraguanNigerianNorthern EuropeanNorwegianOkinawanOsageOttawaPaiutePakistaniPalestinianPanamanianParaguayanPennsylvania GermanPeruvianPimaPolishPortuguesePotawatomiPuebloPuerto RicanPuget Sound SalishRomanianRussianSalvadoranSamoanScandinavianScotch-IrishScottishSeminoleSenegaleseSerbianShoshoneSierra LeoneanSiouxSlavicSlovakSloveneSomaliSouth AfricanSouth AmericanSouth American IndianSoviet UnionSpaniardSpanishSpanish AmericanSpanish American IndianSri LankanSubsaharan AfricanSudaneseSwedishSwissTaiwaneseThaiTlingit-HaidaTohono O'OdhamTonganTrinidadian and TobagonianTsimshianTurkishU.S. Virgin IslanderUgandanUkrainianUruguayanUteVenezuelanVietnameseWelshWest IndianYakamaYaquiYugoslavianYumanYup'ikZimbabwean
Immigration
NonimmigrantsImmigrantsAfghanistanAfricaAlbaniaArgentinaArmeniaAsiaAustraliaAustriaBahamasBangladeshBarbadosBelarusBelgiumBelizeBoliviaBosnia and HerzegovinaBrazilBulgariaBurma/MyanmarCabo VerdeCambodiaCameroonCanadaCaribbeanCentral AmericaChileChinaColombiaCongoCosta RicaCroatiaCubaCzechoslovakiaDenmarkDominicaDominican RepublicEastern AfricaEastern AsiaEastern EuropeEcuadorEgyptEl SalvadorEnglandEritreaEthiopiaEuropeFijiFranceGermanyGhanaGreeceGrenadaGuatemalaGuyanaHaitiHondurasHong KongHungaryIndiaIndonesiaIranIraqIrelandIsraelItalyJamaicaJapanJordanKazakhstanKenyaKoreaKuwaitLaosLatin AmericaLatviaLebanonLiberiaLithuaniaMalaysiaMexicoMicronesiaMiddle AfricaMoldovaMoroccoNepalNetherlandsNicaraguaNigeriaNorth AmericaNorth MacedoniaNorthern AfricaNorthern EuropeNorwayOceaniaPakistanPanamaPeruPhilippinesPolandPortugalRomaniaRussiaSaudi ArabiaScotlandSenegalSerbiaSierra LeoneSingaporeSomaliaSouth AfricaSouth AmericaSouth Central AsiaSouth Eastern AsiaSouthern EuropeSpainSri LankaSt. Vincent and the GrenadinesSudanSwedenSwitzerlandSyriaTaiwanThailandTrinidad and TobagoTurkeyUgandaUkraineUruguayUzbekistanVenezuelaVietnamWest IndiesWestern AfricaWestern AsiaWestern EuropeYemenZaireZimbabweAzores
Receiving Food Stamps
Income
Poverty
Unemployment
Labor Participation
Family Structure
Vehicle Availability
Education Level
Disability

Syrian Receiving Food Stamps
Excellent

11.0%
PUBLIC INCOME | FOOD STAMPS
85.5/ 100
METRIC RATING
144th/ 347
METRIC RANK

Syrian Receiving Food Stamps Correlation Chart

The statistical analysis conducted on geographies consisting of 265,711,936 people shows a slight negative correlation between the proportion of Syrians and percentage of population receiving government assistance and/or food stamps in the United States with a correlation coefficient (R) of -0.050 and weighted average of 11.0%. On average, for every 1% (one percent) increase in Syrians within a typical geography, there is a decrease of 0.085% in percentage of population receiving government assistance and/or food stamps.
Syrian Receiving Food Stamps
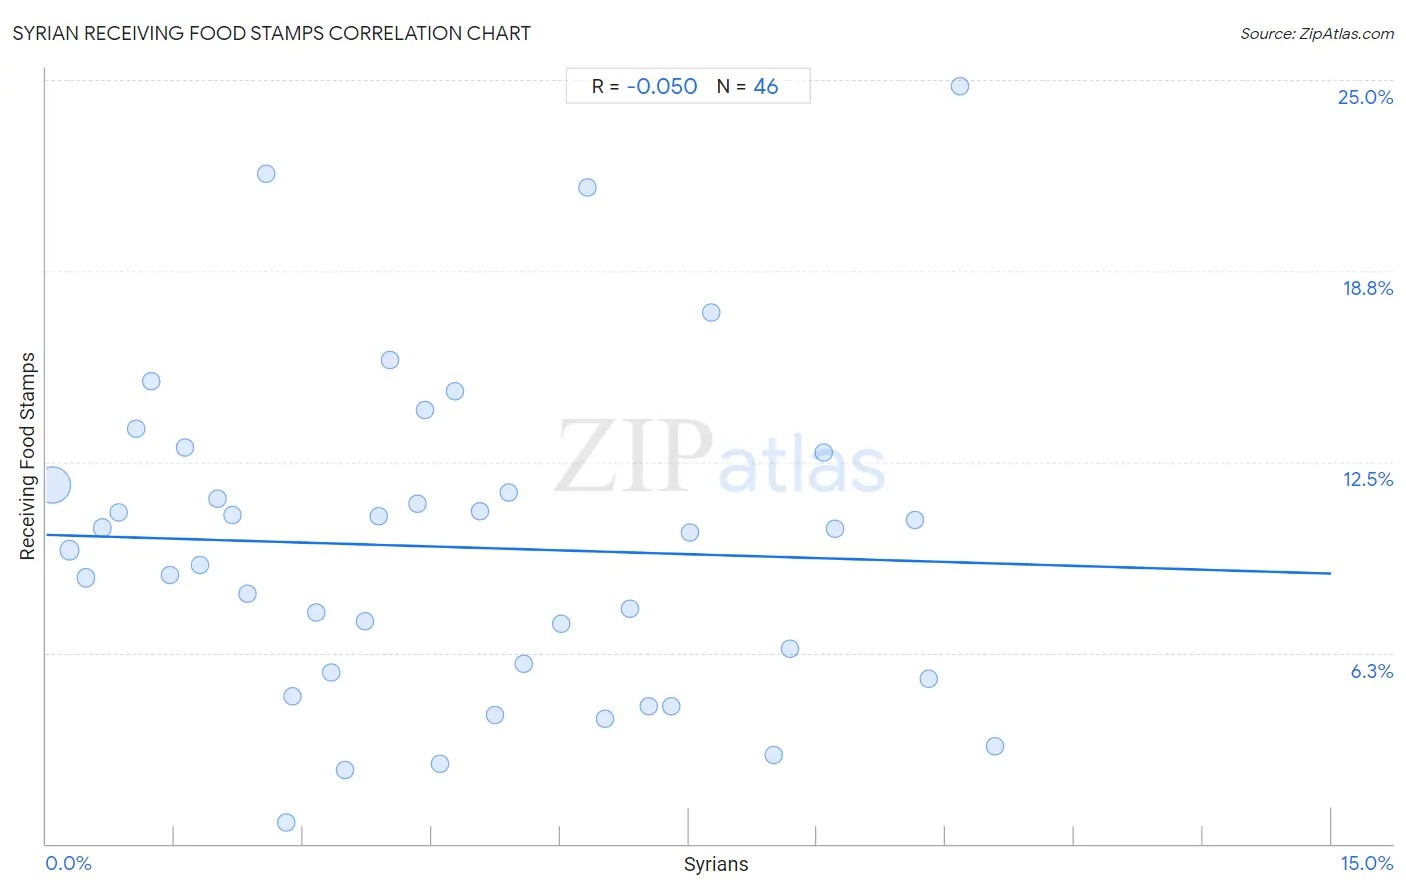
It is essential to understand that the correlation between the percentage of Syrians and percentage of population receiving government assistance and/or food stamps does not imply a direct cause-and-effect relationship. It remains uncertain whether the presence of Syrians influences an upward or downward trend in the level of percentage of population receiving government assistance and/or food stamps within an area, or if Syrians simply ended up residing in those areas with higher or lower levels of percentage of population receiving government assistance and/or food stamps due to other factors.

Demographics Similar to Syrians by Receiving Food Stamps

In terms of receiving food stamps, the demographic groups most similar to Syrians are Hungarian (11.0%, a difference of 0.12%), Immigrants from Northern Africa (11.0%, a difference of 0.15%), Chilean (11.0%, a difference of 0.23%), Taiwanese (11.0%, a difference of 0.36%), and Immigrants from Vietnam (11.0%, a difference of 0.40%).
DemographicsRating | RankReceiving Food Stamps
Immigrants from Eastern Europe
89.8
/100
|
#137
Excellent
10.8%
Immigrants from Moldova
88.5
/100
|
#138
Excellent
10.9%
Hmong
88.4
/100
|
#139
Excellent
10.9%
Celtics
87.8
/100
|
#140
Excellent
10.9%
Immigrants from Vietnam
86.7
/100
|
#141
Excellent
11.0%
Chileans
86.2
/100
|
#142
Excellent
11.0%
Immigrants from Northern Africa
86.0
/100
|
#143
Excellent
11.0%
Syrians
85.5
/100
|
#144
Excellent
11.0%
Hungarians
85.1
/100
|
#145
Excellent
11.0%
Taiwanese
84.2
/100
|
#146
Excellent
11.0%
Whites/Caucasians
83.9
/100
|
#147
Excellent
11.1%
Immigrants from South Eastern Asia
83.3
/100
|
#148
Excellent
11.1%
Brazilians
83.2
/100
|
#149
Excellent
11.1%
Soviet Union
83.1
/100
|
#150
Excellent
11.1%
Immigrants from Spain
81.7
/100
|
#151
Excellent
11.1%

Syrian Receiving Food Stamps Correlation Summary

MeasurementSyrian DataReceiving Food Stamps Data
Minimum0.066%0.68%
Maximum11.1%24.8%
Range11.0%24.1%
Mean4.7%9.7%
Median4.4%9.9%
Interquartile 25% (IQ1)2.2%5.6%
Interquartile 75% (IQ3)7.0%11.7%
Interquartile Range (IQR)4.9%6.1%
Standard Deviation (Sample)3.1%5.3%
Standard Deviation (Population)3.1%5.2%

Correlation Details

Syrian PercentileSample SizeReceiving Food Stamps
[
0.0%
-
0.5%
]
0.066%
223,244,52611.7%
[
0.0%
-
0.5%
]
0.27%
26,130,1789.6%
[
0.0%
-
0.5%
]
0.46%
7,418,2288.7%
[
0.5%
-
1.0%
]
0.65%
3,615,27110.3%
[
0.5%
-
1.0%
]
0.84%
1,696,38310.8%
[
1.0%
-
1.5%
]
1.05%
1,492,33513.6%
[
1.0%
-
1.5%
]
1.22%
639,47215.1%
[
1.0%
-
1.5%
]
1.44%
397,6548.8%
[
1.5%
-
2.0%
]
1.62%
228,21013.0%
[
1.5%
-
2.0%
]
1.79%
139,6259.1%
[
2.0%
-
2.5%
]
2.00%
134,97811.3%
[
2.0%
-
2.5%
]
2.17%
96,17010.8%
[
2.0%
-
2.5%
]
2.35%
53,6438.2%
[
2.5%
-
3.0%
]
2.57%
170,08221.9%
[
2.5%
-
3.0%
]
2.81%
11,3240.68%
[
2.5%
-
3.0%
]
2.87%
28,6674.8%
[
3.0%
-
3.5%
]
3.15%
6,4227.6%
[
3.0%
-
3.5%
]
3.33%
23,7735.6%
[
3.0%
-
3.5%
]
3.49%
14,0562.4%
[
3.5%
-
4.0%
]
3.73%
6,4157.3%
[
3.5%
-
4.0%
]
3.88%
1,34110.7%
[
4.0%
-
4.5%
]
4.01%
17,57515.8%
[
4.0%
-
4.5%
]
4.34%
9,51811.1%
[
4.0%
-
4.5%
]
4.42%
81414.2%
[
4.5%
-
5.0%
]
4.60%
2612.6%
[
4.5%
-
5.0%
]
4.77%
43,60714.8%
[
5.0%
-
5.5%
]
5.07%
1,12510.9%
[
5.0%
-
5.5%
]
5.24%
1,1064.2%
[
5.0%
-
5.5%
]
5.39%
1,05711.5%
[
5.5%
-
6.0%
]
5.57%
6,3775.9%
[
6.0%
-
6.5%
]
6.01%
5,0077.2%
[
6.0%
-
6.5%
]
6.32%
1,55121.5%
[
6.5%
-
7.0%
]
6.52%
1,8114.1%
[
6.5%
-
7.0%
]
6.82%
447.7%
[
7.0%
-
7.5%
]
7.03%
17,0944.5%
[
7.0%
-
7.5%
]
7.30%
1374.5%
[
7.5%
-
8.0%
]
7.51%
85210.2%
[
7.5%
-
8.0%
]
7.76%
43817.4%
[
8.0%
-
8.5%
]
8.50%
4122.9%
[
8.5%
-
9.0%
]
8.68%
6456.4%
[
9.0%
-
9.5%
]
9.08%
16,35812.8%
[
9.0%
-
9.5%
]
9.21%
29,28610.3%
[
10.0%
-
10.5%
]
10.14%
3,32310.6%
[
10.0%
-
10.5%
]
10.30%
7285.4%
[
10.5%
-
11.0%
]
10.67%
1,09724.8%
[
11.0%
-
11.5%
]
11.08%
2,9603.2%