Spaniard Married-Couple Family Poverty

COMPARE

Spaniard
Race
Ancestry
AfghanAfricanAlaska NativeAlaskan AthabascanAlbanianAleutAlsatianAmericanApacheArabArapahoArgentineanArmenianAssyrian/Chaldean/SyriacAustralianAustrianBahamianBangladeshiBarbadianBasqueBelgianBelizeanBermudanBhutaneseBlackfeetBolivianBrazilianBritishBritish West IndianBulgarianBurmeseCajunCambodianCanadianCape VerdeanCarpatho RusynCelticCentral AmericanCentral American IndianCherokeeCheyenneChickasawChileanChineseChippewaChoctawColombianColvilleComancheCosta RicanCreeCreekCroatianCrowCubanCypriotCzechCzechoslovakianDanishDelawareDominicanDutchDutch West IndianEastern EuropeanEcuadorianEgyptianEnglishEstonianEthiopianEuropeanFijianFilipinoFinnishFrenchFrench American IndianFrench CanadianGermanGerman RussianGhanaianGreekGuamanian/ChamorroGuatemalanGuyaneseHaitianHmongHonduranHopiHoumaHungarianIcelanderIndian (Asian)IndonesianInupiatIranianIraqiIrishIroquoisIsraeliItalianJamaicanJapaneseJordanianKenyanKiowaKoreanLaotianLatvianLebaneseLiberianLithuanianLumbeeLuxembourgerMacedonianMalaysianMalteseMarshalleseMenomineeMexicanMexican American IndianMongolianMoroccanNative HawaiianNavajoNepaleseNew ZealanderNicaraguanNigerianNorthern EuropeanNorwegianOkinawanOsageOttawaPaiutePakistaniPalestinianPanamanianParaguayanPennsylvania GermanPeruvianPimaPolishPortuguesePotawatomiPuebloPuerto RicanPuget Sound SalishRomanianRussianSalvadoranSamoanScandinavianScotch-IrishScottishSeminoleSenegaleseSerbianShoshoneSierra LeoneanSiouxSlavicSlovakSloveneSomaliSouth AfricanSouth AmericanSouth American IndianSoviet UnionSpaniardSpanishSpanish AmericanSpanish American IndianSri LankanSubsaharan AfricanSudaneseSwedishSwissSyrianTaiwaneseThaiTlingit-HaidaTohono O'OdhamTonganTrinidadian and TobagonianTsimshianTurkishU.S. Virgin IslanderUgandanUkrainianUruguayanUteVenezuelanVietnameseWelshWest IndianYakamaYaquiYugoslavianYumanYup'ikZimbabwean
Immigration
NonimmigrantsImmigrantsAfghanistanAfricaAlbaniaArgentinaArmeniaAsiaAustraliaAustriaBahamasBangladeshBarbadosBelarusBelgiumBelizeBoliviaBosnia and HerzegovinaBrazilBulgariaBurma/MyanmarCabo VerdeCambodiaCameroonCanadaCaribbeanCentral AmericaChileChinaColombiaCongoCosta RicaCroatiaCubaCzechoslovakiaDenmarkDominicaDominican RepublicEastern AfricaEastern AsiaEastern EuropeEcuadorEgyptEl SalvadorEnglandEritreaEthiopiaEuropeFijiFranceGermanyGhanaGreeceGrenadaGuatemalaGuyanaHaitiHondurasHong KongHungaryIndiaIndonesiaIranIraqIrelandIsraelItalyJamaicaJapanJordanKazakhstanKenyaKoreaKuwaitLaosLatin AmericaLatviaLebanonLiberiaLithuaniaMalaysiaMexicoMicronesiaMiddle AfricaMoldovaMoroccoNepalNetherlandsNicaraguaNigeriaNorth AmericaNorth MacedoniaNorthern AfricaNorthern EuropeNorwayOceaniaPakistanPanamaPeruPhilippinesPolandPortugalRomaniaRussiaSaudi ArabiaScotlandSenegalSerbiaSierra LeoneSingaporeSomaliaSouth AfricaSouth AmericaSouth Central AsiaSouth Eastern AsiaSouthern EuropeSpainSri LankaSt. Vincent and the GrenadinesSudanSwedenSwitzerlandSyriaTaiwanThailandTrinidad and TobagoTurkeyUgandaUkraineUruguayUzbekistanVenezuelaVietnamWest IndiesWestern AfricaWestern AsiaWestern EuropeYemenZaireZimbabweAzores
Select to Compare
Race
Ancestry
AfghanAfricanAlaska NativeAlaskan AthabascanAlbanianAleutAlsatianAmericanApacheArabArapahoArgentineanArmenianAssyrian/Chaldean/SyriacAustralianAustrianBahamianBangladeshiBarbadianBasqueBelgianBelizeanBermudanBhutaneseBlackfeetBolivianBrazilianBritishBritish West IndianBulgarianBurmeseCajunCambodianCanadianCape VerdeanCarpatho RusynCelticCentral AmericanCentral American IndianCherokeeCheyenneChickasawChileanChineseChippewaChoctawColombianColvilleComancheCosta RicanCreeCreekCroatianCrowCubanCypriotCzechCzechoslovakianDanishDelawareDominicanDutchDutch West IndianEastern EuropeanEcuadorianEgyptianEnglishEstonianEthiopianEuropeanFijianFilipinoFinnishFrenchFrench American IndianFrench CanadianGermanGerman RussianGhanaianGreekGuamanian/ChamorroGuatemalanGuyaneseHaitianHmongHonduranHopiHoumaHungarianIcelanderIndian (Asian)IndonesianInupiatIranianIraqiIrishIroquoisIsraeliItalianJamaicanJapaneseJordanianKenyanKiowaKoreanLaotianLatvianLebaneseLiberianLithuanianLumbeeLuxembourgerMacedonianMalaysianMalteseMarshalleseMenomineeMexicanMexican American IndianMongolianMoroccanNative HawaiianNavajoNepaleseNew ZealanderNicaraguanNigerianNorthern EuropeanNorwegianOkinawanOsageOttawaPaiutePakistaniPalestinianPanamanianParaguayanPennsylvania GermanPeruvianPimaPolishPortuguesePotawatomiPuebloPuerto RicanPuget Sound SalishRomanianRussianSalvadoranSamoanScandinavianScotch-IrishScottishSeminoleSenegaleseSerbianShoshoneSierra LeoneanSiouxSlavicSlovakSloveneSomaliSouth AfricanSouth AmericanSouth American IndianSoviet UnionSpanishSpanish AmericanSpanish American IndianSri LankanSubsaharan AfricanSudaneseSwedishSwissSyrianTaiwaneseThaiTlingit-HaidaTohono O'OdhamTonganTrinidadian and TobagonianTsimshianTurkishU.S. Virgin IslanderUgandanUkrainianUruguayanUteVenezuelanVietnameseWelshWest IndianYakamaYaquiYugoslavianYumanYup'ikZimbabwean
Immigration
NonimmigrantsImmigrantsAfghanistanAfricaAlbaniaArgentinaArmeniaAsiaAustraliaAustriaBahamasBangladeshBarbadosBelarusBelgiumBelizeBoliviaBosnia and HerzegovinaBrazilBulgariaBurma/MyanmarCabo VerdeCambodiaCameroonCanadaCaribbeanCentral AmericaChileChinaColombiaCongoCosta RicaCroatiaCubaCzechoslovakiaDenmarkDominicaDominican RepublicEastern AfricaEastern AsiaEastern EuropeEcuadorEgyptEl SalvadorEnglandEritreaEthiopiaEuropeFijiFranceGermanyGhanaGreeceGrenadaGuatemalaGuyanaHaitiHondurasHong KongHungaryIndiaIndonesiaIranIraqIrelandIsraelItalyJamaicaJapanJordanKazakhstanKenyaKoreaKuwaitLaosLatin AmericaLatviaLebanonLiberiaLithuaniaMalaysiaMexicoMicronesiaMiddle AfricaMoldovaMoroccoNepalNetherlandsNicaraguaNigeriaNorth AmericaNorth MacedoniaNorthern AfricaNorthern EuropeNorwayOceaniaPakistanPanamaPeruPhilippinesPolandPortugalRomaniaRussiaSaudi ArabiaScotlandSenegalSerbiaSierra LeoneSingaporeSomaliaSouth AfricaSouth AmericaSouth Central AsiaSouth Eastern AsiaSouthern EuropeSpainSri LankaSt. Vincent and the GrenadinesSudanSwedenSwitzerlandSyriaTaiwanThailandTrinidad and TobagoTurkeyUgandaUkraineUruguayUzbekistanVenezuelaVietnamWest IndiesWestern AfricaWestern AsiaWestern EuropeYemenZaireZimbabweAzores
Married-Couple Family Poverty
Income
Poverty
Unemployment
Labor Participation
Family Structure
Vehicle Availability
Education Level
Disability

Spaniard Married-Couple Family Poverty
Fair

5.4%
POVERTY | MARRIED-COUPLE FAMILIES
27.4/ 100
METRIC RATING
196th/ 347
METRIC RANK

Spaniard Married-Couple Family Poverty Correlation Chart

The statistical analysis conducted on geographies consisting of 439,020,295 people shows a mild positive correlation between the proportion of Spaniards and poverty level among married-couple families in the United States with a correlation coefficient (R) of 0.336 and weighted average of 5.4%. On average, for every 1% (one percent) increase in Spaniards within a typical geography, there is an increase of 0.14% in poverty level among married-couple families.
Spaniard Married-Couple Family Poverty
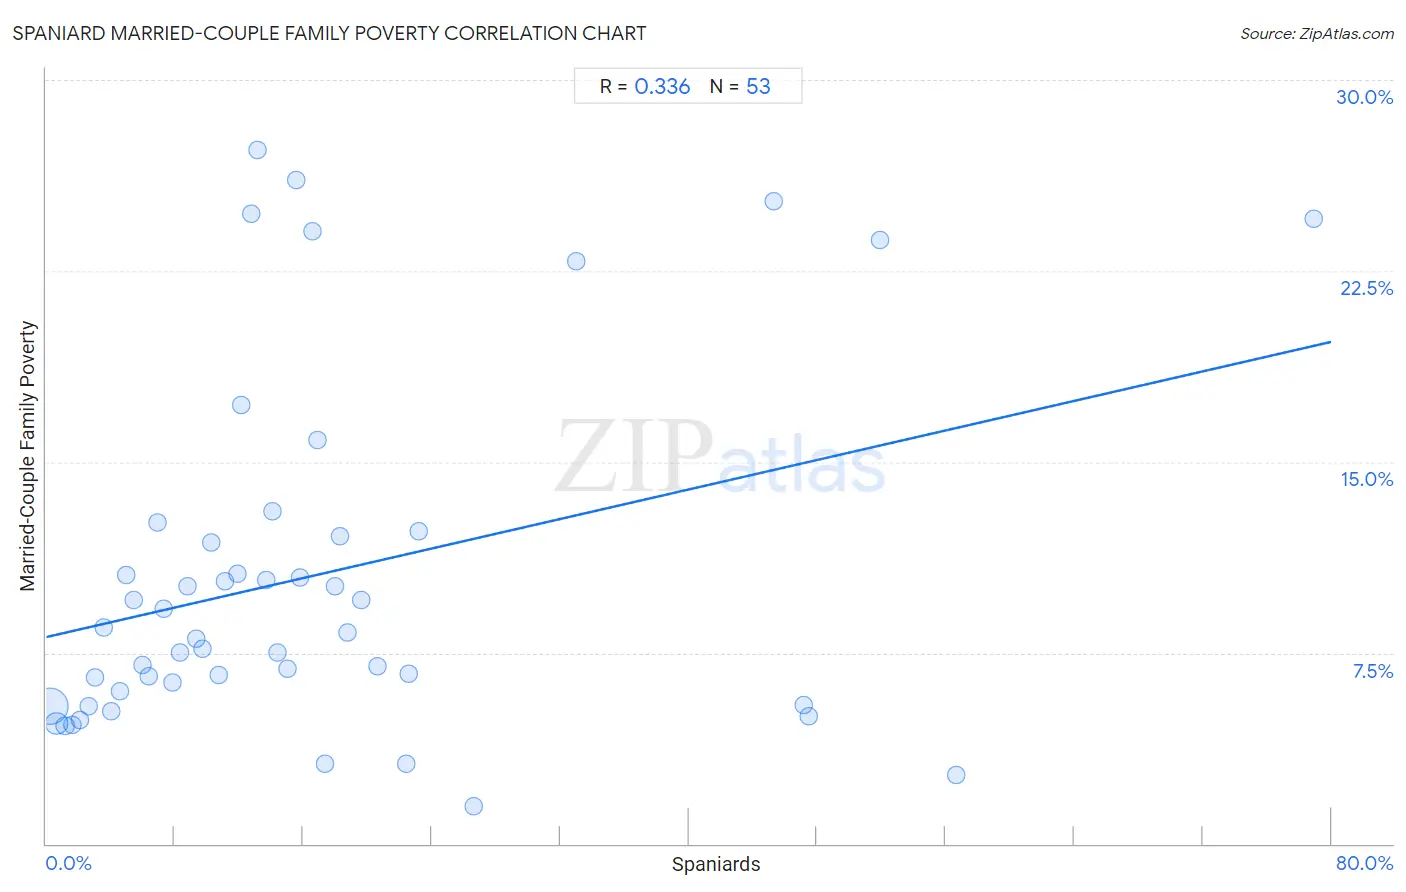
It is essential to understand that the correlation between the percentage of Spaniards and poverty level among married-couple families does not imply a direct cause-and-effect relationship. It remains uncertain whether the presence of Spaniards influences an upward or downward trend in the level of poverty level among married-couple families within an area, or if Spaniards simply ended up residing in those areas with higher or lower levels of poverty level among married-couple families due to other factors.

Demographics Similar to Spaniards by Married-Couple Family Poverty

In terms of married-couple family poverty, the demographic groups most similar to Spaniards are Immigrants from the Azores (5.4%, a difference of 0.020%), Immigrants from Israel (5.4%, a difference of 0.060%), Liberian (5.4%, a difference of 0.15%), Immigrants from Belarus (5.4%, a difference of 0.18%), and Malaysian (5.4%, a difference of 0.29%).
DemographicsRating | RankMarried-Couple Family Poverty
South American Indians
32.5
/100
|
#189
Fair
5.3%
Ugandans
31.6
/100
|
#190
Fair
5.3%
Immigrants from Cabo Verde
30.9
/100
|
#191
Fair
5.3%
Cape Verdeans
30.7
/100
|
#192
Fair
5.3%
Malaysians
29.5
/100
|
#193
Fair
5.4%
Immigrants from Israel
27.8
/100
|
#194
Fair
5.4%
Immigrants from the Azores
27.5
/100
|
#195
Fair
5.4%
Spaniards
27.4
/100
|
#196
Fair
5.4%
Liberians
26.3
/100
|
#197
Fair
5.4%
Immigrants from Belarus
26.2
/100
|
#198
Fair
5.4%
Uruguayans
25.0
/100
|
#199
Fair
5.4%
Immigrants from Morocco
24.3
/100
|
#200
Fair
5.4%
Lebanese
24.1
/100
|
#201
Fair
5.4%
Immigrants from Middle Africa
23.8
/100
|
#202
Fair
5.4%
Immigrants from Peru
21.8
/100
|
#203
Fair
5.4%

Spaniard Married-Couple Family Poverty Correlation Summary

MeasurementSpaniard DataMarried-Couple Family Poverty Data
Minimum0.20%1.5%
Maximum78.9%27.3%
Range78.7%25.8%
Mean16.5%10.5%
Median12.7%8.3%
Interquartile 25% (IQ1)6.2%5.7%
Interquartile 75% (IQ3)19.2%12.2%
Interquartile Range (IQR)13.0%6.5%
Standard Deviation (Sample)15.9%6.9%
Standard Deviation (Population)15.8%6.8%

Correlation Details

Spaniard PercentileSample SizeMarried-Couple Family Poverty
[
0.0%
-
0.5%
]
0.20%
334,415,5825.4%
[
0.5%
-
1.0%
]
0.66%
77,472,4654.7%
[
1.0%
-
1.5%
]
1.15%
15,503,8234.6%
[
1.5%
-
2.0%
]
1.64%
4,274,5444.7%
[
2.0%
-
2.5%
]
2.10%
2,075,3254.9%
[
2.5%
-
3.0%
]
2.62%
1,255,1755.4%
[
3.0%
-
3.5%
]
3.06%
785,0166.5%
[
3.5%
-
4.0%
]
3.60%
495,7658.5%
[
4.0%
-
4.5%
]
4.04%
295,0775.2%
[
4.5%
-
5.0%
]
4.60%
1,043,4766.0%
[
4.5%
-
5.0%
]
4.94%
325,16910.5%
[
5.0%
-
5.5%
]
5.47%
305,7879.6%
[
5.5%
-
6.0%
]
5.97%
268,2557.0%
[
6.0%
-
6.5%
]
6.40%
141,4086.6%
[
6.5%
-
7.0%
]
6.96%
30,00712.6%
[
7.0%
-
7.5%
]
7.34%
19,4389.2%
[
7.5%
-
8.0%
]
7.83%
58,2946.3%
[
8.0%
-
8.5%
]
8.35%
14,8567.5%
[
8.5%
-
9.0%
]
8.78%
19,84110.1%
[
9.0%
-
9.5%
]
9.33%
5,6628.0%
[
9.5%
-
10.0%
]
9.76%
16,0397.7%
[
10.0%
-
10.5%
]
10.26%
51,18411.8%
[
10.5%
-
11.0%
]
10.71%
13,0176.6%
[
11.0%
-
11.5%
]
11.14%
16,61410.3%
[
11.5%
-
12.0%
]
11.90%
17,91810.6%
[
12.0%
-
12.5%
]
12.15%
7,08417.2%
[
12.5%
-
13.0%
]
12.74%
2,27724.8%
[
13.0%
-
13.5%
]
13.14%
2,59527.3%
[
13.5%
-
14.0%
]
13.73%
10,49010.4%
[
14.0%
-
14.5%
]
14.11%
49613.1%
[
14.0%
-
14.5%
]
14.43%
5,6967.5%
[
15.0%
-
15.5%
]
15.05%
7,0026.9%
[
15.5%
-
16.0%
]
15.57%
48826.1%
[
15.5%
-
16.0%
]
15.82%
59410.5%
[
16.5%
-
17.0%
]
16.56%
1,96224.0%
[
16.5%
-
17.0%
]
16.92%
60315.8%
[
17.0%
-
17.5%
]
17.36%
1,5673.2%
[
17.5%
-
18.0%
]
17.96%
3,54210.1%
[
18.0%
-
18.5%
]
18.32%
2,33612.1%
[
18.5%
-
19.0%
]
18.76%
10,7228.3%
[
19.5%
-
20.0%
]
19.59%
4449.6%
[
20.5%
-
21.0%
]
20.62%
20,9107.0%
[
22.0%
-
22.5%
]
22.40%
2,9063.1%
[
22.5%
-
23.0%
]
22.58%
3,2286.7%
[
23.0%
-
23.5%
]
23.23%
5,92012.3%
[
26.5%
-
27.0%
]
26.65%
2,1651.5%
[
32.5%
-
33.0%
]
32.97%
18522.9%
[
45.0%
-
45.5%
]
45.30%
1,78625.2%
[
47.0%
-
47.5%
]
47.19%
1,5495.4%
[
47.0%
-
47.5%
]
47.44%
1,5415.0%
[
51.5%
-
52.0%
]
51.88%
1,85823.7%
[
56.5%
-
57.0%
]
56.66%
4132.7%
[
78.5%
-
79.0%
]
78.89%
19924.5%