Spaniard Unemployment Among Women with Children Ages 6 to 17 years
COMPARE
Spaniard
Select to Compare
Unemployment Among Women with Children Ages 6 to 17 years
Spaniard Unemployment Among Women with Children Ages 6 to 17 years
9.2%
UNEMPLOYMENT | WOMEN W/ CHILDREN 6 TO 17
8.2/ 100
METRIC RATING
213th/ 347
METRIC RANK
Spaniard Unemployment Among Women with Children Ages 6 to 17 years Correlation Chart
The statistical analysis conducted on geographies consisting of 311,847,590 people shows a weak positive correlation between the proportion of Spaniards and unemployment rate among women with children between the ages 6 and 17 in the United States with a correlation coefficient (R) of 0.241 and weighted average of 9.2%. On average, for every 1% (one percent) increase in Spaniards within a typical geography, there is an increase of 0.92% in unemployment rate among women with children between the ages 6 and 17.
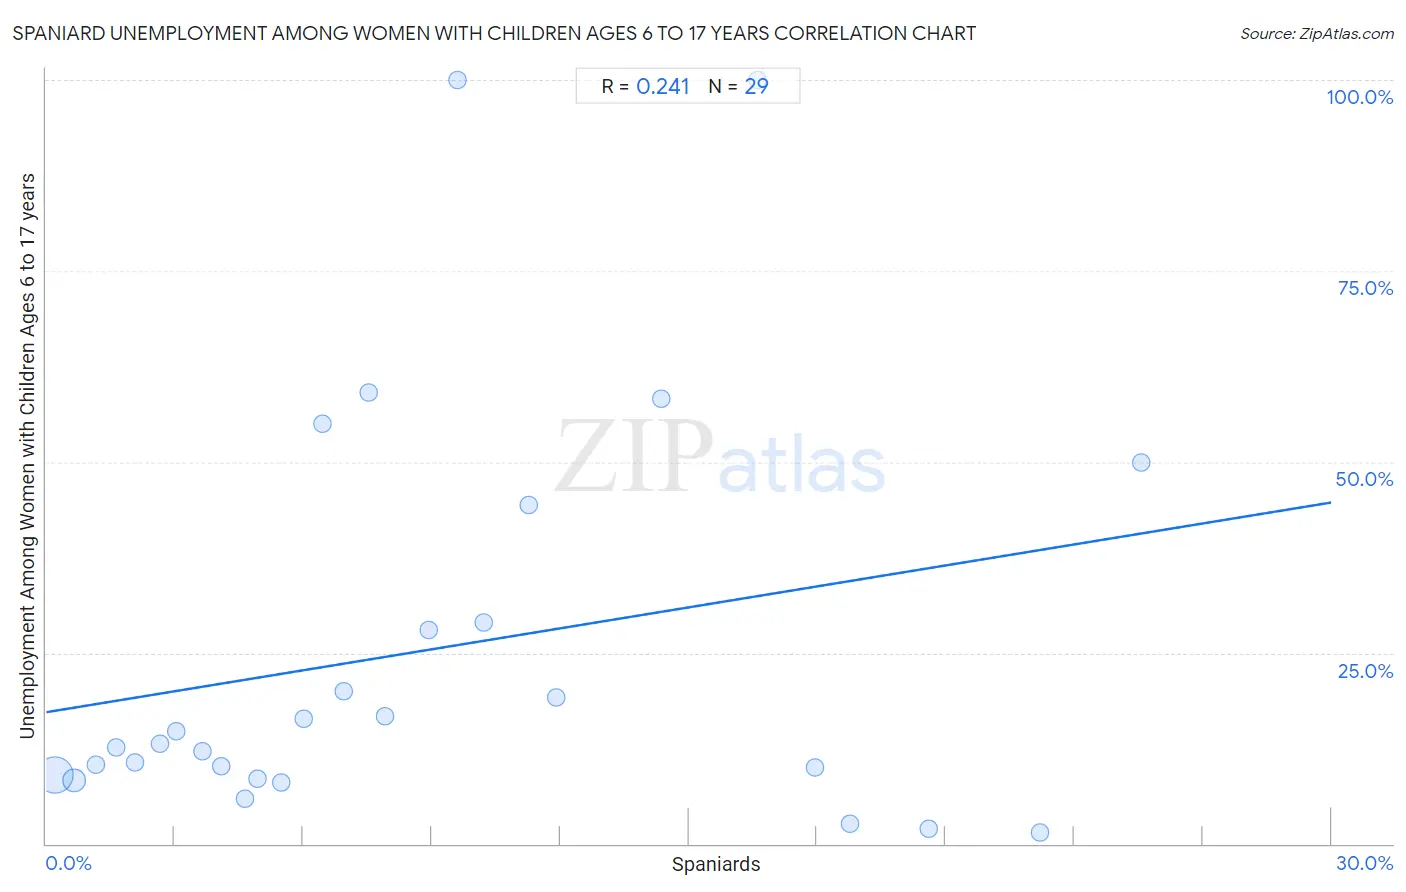
It is essential to understand that the correlation between the percentage of Spaniards and unemployment rate among women with children between the ages 6 and 17 does not imply a direct cause-and-effect relationship. It remains uncertain whether the presence of Spaniards influences an upward or downward trend in the level of unemployment rate among women with children between the ages 6 and 17 within an area, or if Spaniards simply ended up residing in those areas with higher or lower levels of unemployment rate among women with children between the ages 6 and 17 due to other factors.
Demographics Similar to Spaniards by Unemployment Among Women with Children Ages 6 to 17 years
In terms of unemployment among women with children ages 6 to 17 years, the demographic groups most similar to Spaniards are Iroquois (9.2%, a difference of 0.10%), Peruvian (9.2%, a difference of 0.11%), Immigrants from Germany (9.2%, a difference of 0.14%), Immigrants from Uruguay (9.2%, a difference of 0.14%), and German (9.2%, a difference of 0.15%).
| Demographics | Rating | Rank | Unemployment Among Women with Children Ages 6 to 17 years |
| Immigrants from North America | 12.7 /100 | #206 | Poor 9.2% |
| Cubans | 10.9 /100 | #207 | Poor 9.2% |
| Immigrants from Peru | 10.8 /100 | #208 | Poor 9.2% |
| Salvadorans | 10.7 /100 | #209 | Poor 9.2% |
| Finns | 10.0 /100 | #210 | Tragic 9.2% |
| Immigrants from Cuba | 9.6 /100 | #211 | Tragic 9.2% |
| Peruvians | 9.0 /100 | #212 | Tragic 9.2% |
| Spaniards | 8.2 /100 | #213 | Tragic 9.2% |
| Iroquois | 7.5 /100 | #214 | Tragic 9.2% |
| Immigrants from Germany | 7.2 /100 | #215 | Tragic 9.2% |
| Immigrants from Uruguay | 7.2 /100 | #216 | Tragic 9.2% |
| Germans | 7.2 /100 | #217 | Tragic 9.2% |
| Syrians | 6.9 /100 | #218 | Tragic 9.2% |
| Immigrants from Scotland | 6.6 /100 | #219 | Tragic 9.2% |
| Belgians | 6.4 /100 | #220 | Tragic 9.2% |
Spaniard Unemployment Among Women with Children Ages 6 to 17 years Correlation Summary
| Measurement | Spaniard Data | Unemployment Among Women with Children Ages 6 to 17 years Data |
| Minimum | 0.21% | 1.4% |
| Maximum | 25.6% | 100.0% |
| Range | 25.4% | 98.6% |
| Mean | 8.9% | 25.4% |
| Median | 7.0% | 13.1% |
| Interquartile 25% (IQ1) | 3.3% | 8.7% |
| Interquartile 75% (IQ3) | 13.1% | 36.7% |
| Interquartile Range (IQR) | 9.8% | 27.9% |
| Standard Deviation (Sample) | 7.1% | 26.8% |
| Standard Deviation (Population) | 6.9% | 26.3% |
Correlation Details
| Spaniard Percentile | Sample Size | Unemployment Among Women with Children Ages 6 to 17 years |
[ 0.0% - 0.5% ] 0.21% | 242,850,343 | 9.0% |
[ 0.5% - 1.0% ] 0.66% | 54,843,533 | 8.3% |
[ 1.0% - 1.5% ] 1.15% | 8,691,511 | 10.3% |
[ 1.5% - 2.0% ] 1.63% | 1,751,605 | 12.6% |
[ 2.0% - 2.5% ] 2.08% | 1,030,357 | 10.7% |
[ 2.5% - 3.0% ] 2.67% | 558,914 | 13.1% |
[ 3.0% - 3.5% ] 3.02% | 332,331 | 14.7% |
[ 3.5% - 4.0% ] 3.64% | 179,062 | 12.2% |
[ 4.0% - 4.5% ] 4.09% | 90,841 | 10.1% |
[ 4.5% - 5.0% ] 4.63% | 852,983 | 6.0% |
[ 4.5% - 5.0% ] 4.94% | 223,161 | 8.5% |
[ 5.0% - 5.5% ] 5.49% | 118,560 | 8.1% |
[ 6.0% - 6.5% ] 6.00% | 225,906 | 16.3% |
[ 6.0% - 6.5% ] 6.44% | 26,210 | 55.0% |
[ 6.5% - 7.0% ] 6.96% | 460 | 20.0% |
[ 7.5% - 8.0% ] 7.52% | 4,258 | 59.0% |
[ 7.5% - 8.0% ] 7.89% | 532 | 16.7% |
[ 8.5% - 9.0% ] 8.93% | 5,389 | 28.1% |
[ 9.5% - 10.0% ] 9.60% | 1,187 | 100.0% |
[ 10.0% - 10.5% ] 10.21% | 6,201 | 28.9% |
[ 11.0% - 11.5% ] 11.28% | 266 | 44.4% |
[ 11.5% - 12.0% ] 11.91% | 17,462 | 19.2% |
[ 14.0% - 14.5% ] 14.35% | 481 | 58.3% |
[ 16.5% - 17.0% ] 16.60% | 235 | 100.0% |
[ 17.5% - 18.0% ] 17.94% | 2,336 | 10.0% |
[ 18.5% - 19.0% ] 18.75% | 10,473 | 2.7% |
[ 20.5% - 21.0% ] 20.61% | 19,827 | 2.0% |
[ 23.0% - 23.5% ] 23.20% | 2,806 | 1.4% |
[ 25.5% - 26.0% ] 25.56% | 360 | 50.0% |