Spaniard College, Under 1 year
COMPARE
Spaniard
Select to Compare
College, Under 1 year
Spaniard College, Under 1 year
65.3%
COLLEGE, UNDER 1 YEAR
45.5/ 100
METRIC RATING
181st/ 347
METRIC RANK
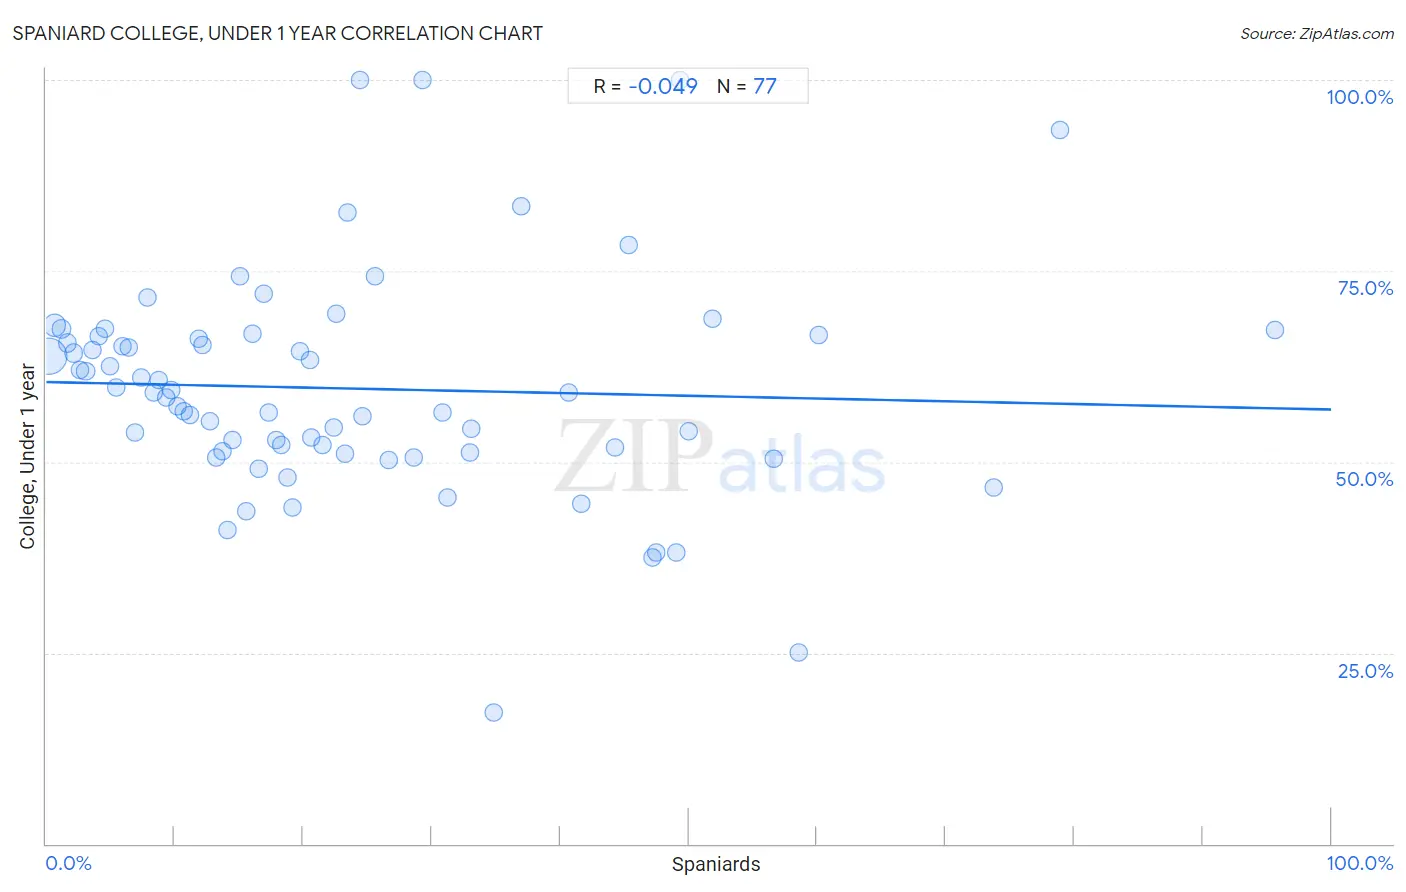
Spaniard College, Under 1 year Correlation Chart
The statistical analysis conducted on geographies consisting of 443,543,124 people shows no correlation between the proportion of Spaniards and percentage of population with at least college, under 1 year education in the United States with a correlation coefficient (R) of -0.049 and weighted average of 65.3%. On average, for every 1% (one percent) increase in Spaniards within a typical geography, there is a decrease of 0.036% in percentage of population with at least college, under 1 year education.
It is essential to understand that the correlation between the percentage of Spaniards and percentage of population with at least college, under 1 year education does not imply a direct cause-and-effect relationship. It remains uncertain whether the presence of Spaniards influences an upward or downward trend in the level of percentage of population with at least college, under 1 year education within an area, or if Spaniards simply ended up residing in those areas with higher or lower levels of percentage of population with at least college, under 1 year education due to other factors.
Demographics Similar to Spaniards by College, Under 1 year
In terms of college, under 1 year, the demographic groups most similar to Spaniards are Dutch (65.3%, a difference of 0.030%), Immigrants from Africa (65.3%, a difference of 0.040%), German Russian (65.4%, a difference of 0.12%), Guamanian/Chamorro (65.4%, a difference of 0.12%), and Immigrants from Poland (65.2%, a difference of 0.13%).
| Demographics | Rating | Rank | College, Under 1 year |
| Immigrants from Bosnia and Herzegovina | 50.0 /100 | #174 | Average 65.4% |
| Scotch-Irish | 49.5 /100 | #175 | Average 65.4% |
| French | 48.9 /100 | #176 | Average 65.4% |
| Immigrants from North Macedonia | 48.6 /100 | #177 | Average 65.4% |
| German Russians | 48.3 /100 | #178 | Average 65.4% |
| Guamanians/Chamorros | 48.2 /100 | #179 | Average 65.4% |
| Dutch | 46.1 /100 | #180 | Average 65.3% |
| Spaniards | 45.5 /100 | #181 | Average 65.3% |
| Immigrants from Africa | 44.7 /100 | #182 | Average 65.3% |
| Immigrants from Poland | 42.6 /100 | #183 | Average 65.2% |
| Bermudans | 42.0 /100 | #184 | Average 65.2% |
| Sri Lankans | 41.7 /100 | #185 | Average 65.2% |
| Immigrants from Sierra Leone | 39.7 /100 | #186 | Fair 65.1% |
| Immigrants from Southern Europe | 34.3 /100 | #187 | Fair 64.9% |
| Immigrants from Albania | 32.0 /100 | #188 | Fair 64.9% |
Spaniard College, Under 1 year Correlation Summary
| Measurement | Spaniard Data | College, Under 1 year Data |
| Minimum | 0.20% | 17.2% |
| Maximum | 95.6% | 100.0% |
| Range | 95.4% | 82.8% |
| Mean | 23.7% | 59.6% |
| Median | 18.3% | 59.1% |
| Interquartile 25% (IQ1) | 9.0% | 51.3% |
| Interquartile 75% (IQ3) | 33.0% | 66.5% |
| Interquartile Range (IQR) | 24.0% | 15.2% |
| Standard Deviation (Sample) | 19.8% | 14.6% |
| Standard Deviation (Population) | 19.6% | 14.5% |
Correlation Details
| Spaniard Percentile | Sample Size | College, Under 1 year |
[ 0.0% - 0.5% ] 0.20% | 336,747,546 | 63.8% |
[ 0.5% - 1.0% ] 0.66% | 78,495,871 | 67.8% |
[ 1.0% - 1.5% ] 1.15% | 15,950,378 | 67.4% |
[ 1.5% - 2.0% ] 1.65% | 4,507,247 | 65.6% |
[ 2.0% - 2.5% ] 2.10% | 2,197,945 | 64.2% |
[ 2.5% - 3.0% ] 2.62% | 1,328,269 | 62.0% |
[ 3.0% - 3.5% ] 3.06% | 814,102 | 61.8% |
[ 3.5% - 4.0% ] 3.59% | 542,199 | 64.7% |
[ 4.0% - 4.5% ] 4.04% | 321,911 | 66.4% |
[ 4.5% - 5.0% ] 4.60% | 1,081,576 | 67.4% |
[ 4.5% - 5.0% ] 4.95% | 345,441 | 62.5% |
[ 5.0% - 5.5% ] 5.47% | 308,814 | 59.8% |
[ 5.5% - 6.0% ] 5.97% | 292,138 | 65.1% |
[ 6.0% - 6.5% ] 6.41% | 153,678 | 65.0% |
[ 6.5% - 7.0% ] 6.95% | 36,701 | 53.9% |
[ 7.0% - 7.5% ] 7.41% | 48,379 | 61.0% |
[ 7.5% - 8.0% ] 7.84% | 62,101 | 71.5% |
[ 8.0% - 8.5% ] 8.38% | 17,826 | 59.1% |
[ 8.5% - 9.0% ] 8.79% | 23,158 | 60.7% |
[ 9.0% - 9.5% ] 9.30% | 12,069 | 58.4% |
[ 9.5% - 10.0% ] 9.76% | 17,410 | 59.4% |
[ 10.0% - 10.5% ] 10.26% | 53,332 | 57.3% |
[ 10.5% - 11.0% ] 10.71% | 14,039 | 56.7% |
[ 11.0% - 11.5% ] 11.14% | 18,245 | 56.1% |
[ 11.5% - 12.0% ] 11.90% | 18,069 | 66.1% |
[ 12.0% - 12.5% ] 12.15% | 8,159 | 65.3% |
[ 12.5% - 13.0% ] 12.74% | 2,496 | 55.4% |
[ 13.0% - 13.5% ] 13.18% | 4,157 | 50.5% |
[ 13.5% - 14.0% ] 13.72% | 11,095 | 51.3% |
[ 14.0% - 14.5% ] 14.10% | 1,532 | 41.2% |
[ 14.0% - 14.5% ] 14.48% | 6,733 | 52.9% |
[ 15.0% - 15.5% ] 15.05% | 8,088 | 74.3% |
[ 15.5% - 16.0% ] 15.52% | 1,740 | 43.5% |
[ 16.0% - 16.5% ] 16.03% | 1,578 | 66.8% |
[ 16.5% - 17.0% ] 16.54% | 2,817 | 49.1% |
[ 16.5% - 17.0% ] 16.90% | 1,852 | 72.0% |
[ 17.0% - 17.5% ] 17.36% | 1,567 | 56.5% |
[ 17.5% - 18.0% ] 17.94% | 4,761 | 52.9% |
[ 18.0% - 18.5% ] 18.32% | 2,336 | 52.3% |
[ 18.5% - 19.0% ] 18.76% | 10,722 | 48.0% |
[ 19.0% - 19.5% ] 19.21% | 2,889 | 44.0% |
[ 19.5% - 20.0% ] 19.76% | 1,189 | 64.4% |
[ 20.5% - 21.0% ] 20.51% | 156 | 63.3% |
[ 20.5% - 21.0% ] 20.62% | 20,910 | 53.3% |
[ 21.0% - 21.5% ] 21.48% | 2,179 | 52.1% |
[ 22.0% - 22.5% ] 22.37% | 4,650 | 54.5% |
[ 22.5% - 23.0% ] 22.59% | 3,285 | 69.3% |
[ 23.0% - 23.5% ] 23.23% | 6,280 | 51.1% |
[ 23.0% - 23.5% ] 23.48% | 115 | 82.6% |
[ 24.0% - 24.5% ] 24.38% | 242 | 100.0% |
[ 24.5% - 25.0% ] 24.66% | 1,168 | 55.9% |
[ 25.5% - 26.0% ] 25.56% | 360 | 74.3% |
[ 26.5% - 27.0% ] 26.65% | 2,233 | 50.3% |
[ 28.5% - 29.0% ] 28.57% | 91 | 50.5% |
[ 29.0% - 29.5% ] 29.29% | 239 | 100.0% |
[ 30.5% - 31.0% ] 30.82% | 1,684 | 56.5% |
[ 31.0% - 31.5% ] 31.22% | 1,864 | 45.4% |
[ 32.5% - 33.0% ] 32.97% | 185 | 51.3% |
[ 33.0% - 33.5% ] 33.07% | 127 | 54.3% |
[ 34.5% - 35.0% ] 34.83% | 201 | 17.2% |
[ 37.0% - 37.5% ] 37.01% | 589 | 83.5% |
[ 40.5% - 41.0% ] 40.69% | 1,504 | 59.2% |
[ 41.5% - 42.0% ] 41.66% | 797 | 44.6% |
[ 44.0% - 44.5% ] 44.26% | 2,212 | 51.8% |
[ 45.0% - 45.5% ] 45.30% | 1,786 | 78.4% |
[ 47.0% - 47.5% ] 47.19% | 1,549 | 37.4% |
[ 47.0% - 47.5% ] 47.44% | 1,541 | 38.2% |
[ 49.0% - 49.5% ] 49.06% | 530 | 38.1% |
[ 49.0% - 49.5% ] 49.29% | 211 | 100.0% |
[ 50.0% - 50.5% ] 50.00% | 82 | 54.0% |
[ 51.5% - 52.0% ] 51.88% | 2,016 | 68.8% |
[ 56.5% - 57.0% ] 56.66% | 413 | 50.5% |
[ 58.5% - 59.0% ] 58.59% | 227 | 25.0% |
[ 60.0% - 60.5% ] 60.11% | 371 | 66.5% |
[ 73.5% - 74.0% ] 73.70% | 540 | 46.7% |
[ 78.5% - 79.0% ] 78.89% | 199 | 93.5% |
[ 95.5% - 96.0% ] 95.61% | 433 | 67.3% |