Spaniard Self-Care Disability
COMPARE
Spaniard
Select to Compare
Self-Care Disability
Spaniard Self-Care Disability
2.6%
SELF-CARE DISABILITY
3.8/ 100
METRIC RATING
222nd/ 347
METRIC RANK
Spaniard Self-Care Disability Correlation Chart
The statistical analysis conducted on geographies consisting of 442,715,832 people shows a moderate positive correlation between the proportion of Spaniards and percentage of population with self-care disability in the United States with a correlation coefficient (R) of 0.429 and weighted average of 2.6%. On average, for every 1% (one percent) increase in Spaniards within a typical geography, there is an increase of 0.046% in percentage of population with self-care disability.
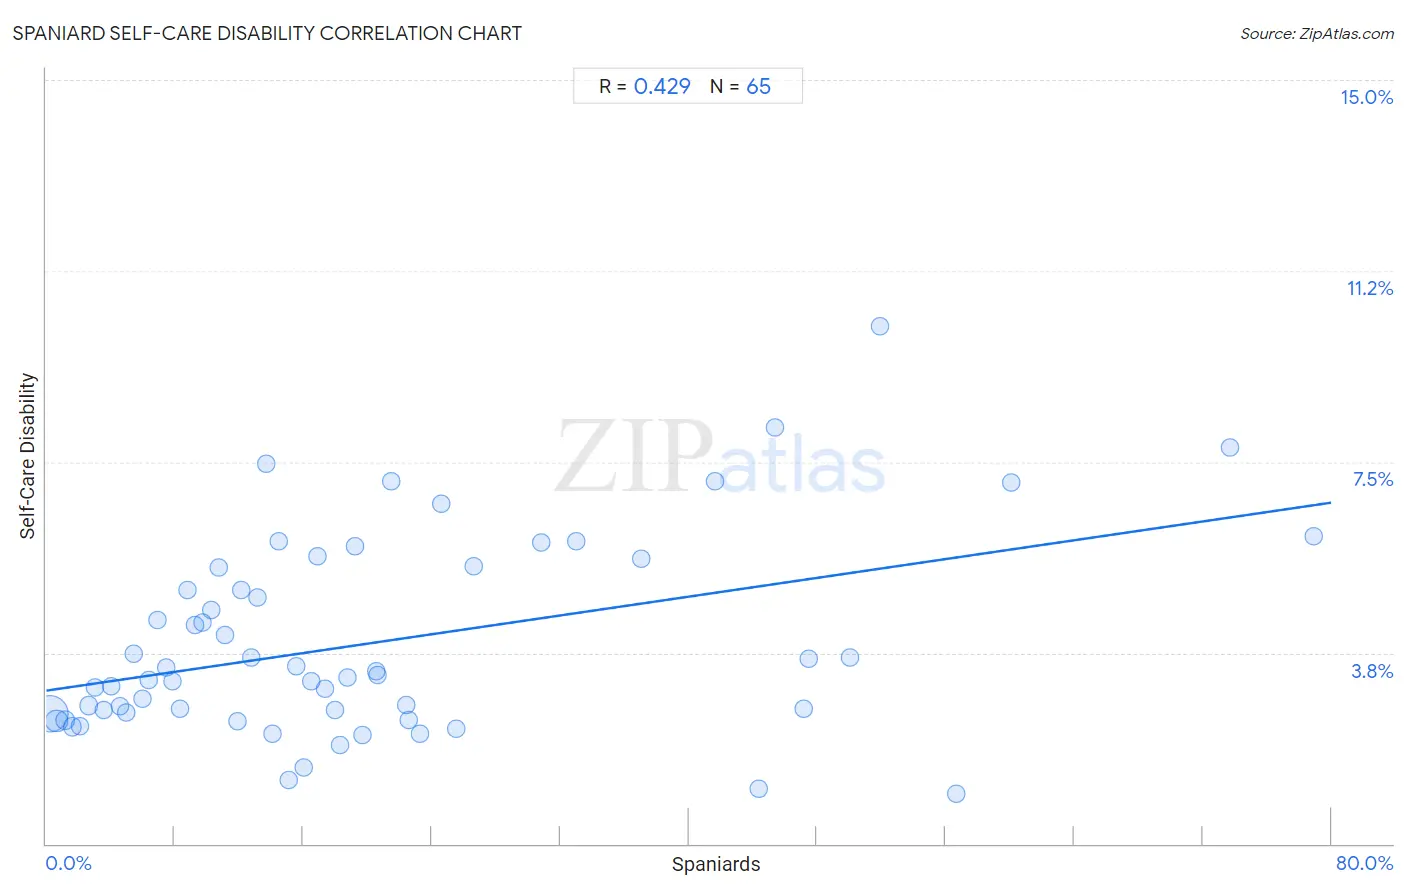
It is essential to understand that the correlation between the percentage of Spaniards and percentage of population with self-care disability does not imply a direct cause-and-effect relationship. It remains uncertain whether the presence of Spaniards influences an upward or downward trend in the level of percentage of population with self-care disability within an area, or if Spaniards simply ended up residing in those areas with higher or lower levels of percentage of population with self-care disability due to other factors.
Demographics Similar to Spaniards by Self-Care Disability
In terms of self-care disability, the demographic groups most similar to Spaniards are French Canadian (2.6%, a difference of 0.0%), Honduran (2.6%, a difference of 0.010%), Subsaharan African (2.6%, a difference of 0.050%), Immigrants from Moldova (2.6%, a difference of 0.060%), and Osage (2.6%, a difference of 0.060%).
| Demographics | Rating | Rank | Self-Care Disability |
| Immigrants from Thailand | 4.5 /100 | #215 | Tragic 2.6% |
| Whites/Caucasians | 4.4 /100 | #216 | Tragic 2.6% |
| Celtics | 4.4 /100 | #217 | Tragic 2.6% |
| Scotch-Irish | 4.1 /100 | #218 | Tragic 2.6% |
| Immigrants from Moldova | 4.0 /100 | #219 | Tragic 2.6% |
| Sub-Saharan Africans | 4.0 /100 | #220 | Tragic 2.6% |
| Hondurans | 3.8 /100 | #221 | Tragic 2.6% |
| Spaniards | 3.8 /100 | #222 | Tragic 2.6% |
| French Canadians | 3.8 /100 | #223 | Tragic 2.6% |
| Osage | 3.6 /100 | #224 | Tragic 2.6% |
| Iraqis | 3.2 /100 | #225 | Tragic 2.6% |
| Chinese | 2.9 /100 | #226 | Tragic 2.6% |
| Immigrants from Philippines | 2.7 /100 | #227 | Tragic 2.6% |
| Guatemalans | 2.7 /100 | #228 | Tragic 2.6% |
| Guamanians/Chamorros | 2.5 /100 | #229 | Tragic 2.6% |
Spaniard Self-Care Disability Correlation Summary
| Measurement | Spaniard Data | Self-Care Disability Data |
| Minimum | 0.20% | 0.97% |
| Maximum | 78.9% | 10.2% |
| Range | 78.7% | 9.2% |
| Mean | 20.4% | 3.9% |
| Median | 15.5% | 3.3% |
| Interquartile 25% (IQ1) | 7.6% | 2.6% |
| Interquartile 75% (IQ3) | 25.1% | 5.4% |
| Interquartile Range (IQR) | 17.4% | 2.9% |
| Standard Deviation (Sample) | 18.0% | 1.9% |
| Standard Deviation (Population) | 17.8% | 1.9% |
Correlation Details
| Spaniard Percentile | Sample Size | Self-Care Disability |
[ 0.0% - 0.5% ] 0.20% | 336,389,389 | 2.6% |
[ 0.5% - 1.0% ] 0.66% | 78,277,981 | 2.4% |
[ 1.0% - 1.5% ] 1.15% | 15,863,351 | 2.4% |
[ 1.5% - 2.0% ] 1.65% | 4,479,951 | 2.3% |
[ 2.0% - 2.5% ] 2.10% | 2,163,403 | 2.3% |
[ 2.5% - 3.0% ] 2.62% | 1,312,447 | 2.7% |
[ 3.0% - 3.5% ] 3.06% | 810,246 | 3.1% |
[ 3.5% - 4.0% ] 3.59% | 537,068 | 2.6% |
[ 4.0% - 4.5% ] 4.04% | 320,110 | 3.1% |
[ 4.5% - 5.0% ] 4.60% | 1,072,471 | 2.7% |
[ 4.5% - 5.0% ] 4.95% | 332,350 | 2.6% |
[ 5.0% - 5.5% ] 5.47% | 303,309 | 3.7% |
[ 5.5% - 6.0% ] 5.97% | 289,940 | 2.8% |
[ 6.0% - 6.5% ] 6.41% | 151,039 | 3.2% |
[ 6.5% - 7.0% ] 6.94% | 32,236 | 4.4% |
[ 7.0% - 7.5% ] 7.43% | 42,842 | 3.5% |
[ 7.5% - 8.0% ] 7.83% | 57,778 | 3.2% |
[ 8.0% - 8.5% ] 8.36% | 16,678 | 2.7% |
[ 8.5% - 9.0% ] 8.79% | 22,938 | 5.0% |
[ 9.0% - 9.5% ] 9.28% | 9,364 | 4.3% |
[ 9.5% - 10.0% ] 9.75% | 15,227 | 4.4% |
[ 10.0% - 10.5% ] 10.26% | 53,012 | 4.6% |
[ 10.5% - 11.0% ] 10.71% | 14,039 | 5.4% |
[ 11.0% - 11.5% ] 11.15% | 17,422 | 4.1% |
[ 11.5% - 12.0% ] 11.90% | 17,985 | 2.4% |
[ 12.0% - 12.5% ] 12.16% | 7,215 | 5.0% |
[ 12.5% - 13.0% ] 12.74% | 2,496 | 3.6% |
[ 13.0% - 13.5% ] 13.18% | 1,495 | 4.8% |
[ 13.5% - 14.0% ] 13.72% | 10,845 | 7.5% |
[ 14.0% - 14.5% ] 14.10% | 1,532 | 2.2% |
[ 14.0% - 14.5% ] 14.44% | 5,866 | 5.9% |
[ 15.0% - 15.5% ] 15.06% | 6,977 | 1.3% |
[ 15.5% - 16.0% ] 15.53% | 1,384 | 3.5% |
[ 16.0% - 16.5% ] 16.03% | 1,578 | 1.5% |
[ 16.0% - 16.5% ] 16.49% | 1,164 | 3.2% |
[ 16.5% - 17.0% ] 16.92% | 603 | 5.7% |
[ 17.0% - 17.5% ] 17.36% | 1,567 | 3.0% |
[ 17.5% - 18.0% ] 17.94% | 4,108 | 2.6% |
[ 18.0% - 18.5% ] 18.31% | 2,065 | 1.9% |
[ 18.5% - 19.0% ] 18.76% | 10,722 | 3.3% |
[ 19.0% - 19.5% ] 19.21% | 2,889 | 5.8% |
[ 19.5% - 20.0% ] 19.70% | 802 | 2.1% |
[ 20.5% - 21.0% ] 20.51% | 156 | 3.4% |
[ 20.5% - 21.0% ] 20.62% | 20,483 | 3.3% |
[ 21.0% - 21.5% ] 21.48% | 2,179 | 7.1% |
[ 22.0% - 22.5% ] 22.40% | 2,906 | 2.7% |
[ 22.5% - 23.0% ] 22.59% | 3,285 | 2.4% |
[ 23.0% - 23.5% ] 23.24% | 5,396 | 2.2% |
[ 24.5% - 25.0% ] 24.59% | 610 | 6.7% |
[ 25.5% - 26.0% ] 25.56% | 360 | 2.2% |
[ 26.5% - 27.0% ] 26.65% | 2,165 | 5.5% |
[ 30.5% - 31.0% ] 30.82% | 1,684 | 5.9% |
[ 32.5% - 33.0% ] 32.97% | 185 | 5.9% |
[ 37.0% - 37.5% ] 37.01% | 589 | 5.6% |
[ 41.5% - 42.0% ] 41.66% | 797 | 7.1% |
[ 44.0% - 44.5% ] 44.39% | 1,122 | 1.1% |
[ 45.0% - 45.5% ] 45.38% | 1,320 | 8.2% |
[ 47.0% - 47.5% ] 47.19% | 1,549 | 2.6% |
[ 47.0% - 47.5% ] 47.44% | 1,541 | 3.6% |
[ 50.0% - 50.5% ] 50.00% | 82 | 3.7% |
[ 51.5% - 52.0% ] 51.88% | 2,016 | 10.2% |
[ 56.5% - 57.0% ] 56.66% | 413 | 0.97% |
[ 60.0% - 60.5% ] 60.11% | 371 | 7.1% |
[ 73.5% - 74.0% ] 73.70% | 540 | 7.8% |
[ 78.5% - 79.0% ] 78.89% | 199 | 6.0% |