Spaniard Married-couple Households
COMPARE
Spaniard
Select to Compare
Married-couple Households
Spaniard Married-couple Households
47.2%
MARRIED-COUPLE HOUSEHOLDS
84.1/ 100
METRIC RATING
142nd/ 347
METRIC RANK
Spaniard Married-couple Households Correlation Chart
The statistical analysis conducted on geographies consisting of 443,146,700 people shows a weak positive correlation between the proportion of Spaniards and percentage of married-couple family households in the United States with a correlation coefficient (R) of 0.215 and weighted average of 47.2%. On average, for every 1% (one percent) increase in Spaniards within a typical geography, there is an increase of 0.17% in percentage of married-couple family households.
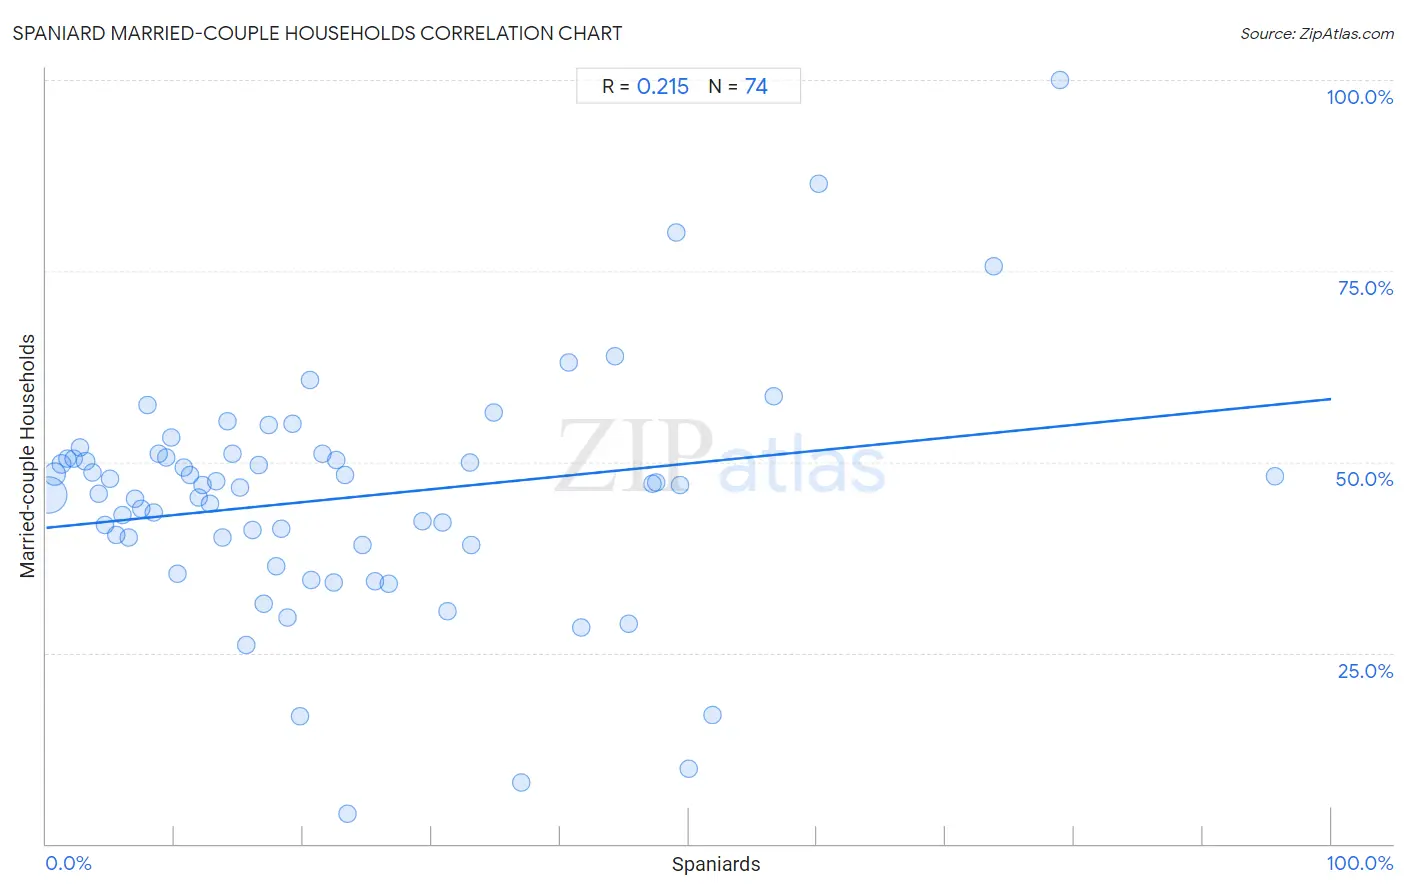
It is essential to understand that the correlation between the percentage of Spaniards and percentage of married-couple family households does not imply a direct cause-and-effect relationship. It remains uncertain whether the presence of Spaniards influences an upward or downward trend in the level of percentage of married-couple family households within an area, or if Spaniards simply ended up residing in those areas with higher or lower levels of percentage of married-couple family households due to other factors.
Demographics Similar to Spaniards by Married-couple Households
In terms of married-couple households, the demographic groups most similar to Spaniards are Spanish (47.2%, a difference of 0.020%), Costa Rican (47.2%, a difference of 0.020%), Immigrants from Belarus (47.2%, a difference of 0.020%), Immigrants from Sweden (47.2%, a difference of 0.040%), and Mexican (47.1%, a difference of 0.050%).
| Demographics | Rating | Rank | Married-couple Households |
| Immigrants from Argentina | 86.0 /100 | #135 | Excellent 47.2% |
| New Zealanders | 85.3 /100 | #136 | Excellent 47.2% |
| Immigrants from Malaysia | 85.2 /100 | #137 | Excellent 47.2% |
| Immigrants from Afghanistan | 85.1 /100 | #138 | Excellent 47.2% |
| Immigrants from Sweden | 84.7 /100 | #139 | Excellent 47.2% |
| Spanish | 84.5 /100 | #140 | Excellent 47.2% |
| Costa Ricans | 84.4 /100 | #141 | Excellent 47.2% |
| Spaniards | 84.1 /100 | #142 | Excellent 47.2% |
| Immigrants from Belarus | 83.8 /100 | #143 | Excellent 47.2% |
| Mexicans | 83.4 /100 | #144 | Excellent 47.1% |
| Slovenes | 81.7 /100 | #145 | Excellent 47.1% |
| Immigrants from Western Europe | 81.6 /100 | #146 | Excellent 47.1% |
| Immigrants from Syria | 81.6 /100 | #147 | Excellent 47.1% |
| Icelanders | 79.5 /100 | #148 | Good 47.0% |
| Paraguayans | 78.7 /100 | #149 | Good 47.0% |
Spaniard Married-couple Households Correlation Summary
| Measurement | Spaniard Data | Married-couple Households Data |
| Minimum | 0.20% | 4.0% |
| Maximum | 95.6% | 100.0% |
| Range | 95.4% | 96.0% |
| Mean | 23.1% | 45.3% |
| Median | 17.6% | 47.0% |
| Interquartile 25% (IQ1) | 8.8% | 39.1% |
| Interquartile 75% (IQ3) | 33.0% | 50.6% |
| Interquartile Range (IQR) | 24.2% | 11.4% |
| Standard Deviation (Sample) | 19.7% | 15.4% |
| Standard Deviation (Population) | 19.6% | 15.3% |
Correlation Details
| Spaniard Percentile | Sample Size | Married-couple Households |
[ 0.0% - 0.5% ] 0.20% | 336,557,460 | 45.6% |
[ 0.5% - 1.0% ] 0.66% | 78,362,933 | 48.4% |
[ 1.0% - 1.5% ] 1.15% | 15,902,760 | 49.7% |
[ 1.5% - 2.0% ] 1.65% | 4,495,602 | 50.4% |
[ 2.0% - 2.5% ] 2.10% | 2,191,851 | 50.3% |
[ 2.5% - 3.0% ] 2.62% | 1,324,644 | 51.8% |
[ 3.0% - 3.5% ] 3.06% | 813,699 | 50.1% |
[ 3.5% - 4.0% ] 3.59% | 542,199 | 48.6% |
[ 4.0% - 4.5% ] 4.04% | 321,587 | 45.8% |
[ 4.5% - 5.0% ] 4.60% | 1,081,576 | 41.7% |
[ 4.5% - 5.0% ] 4.95% | 344,481 | 47.9% |
[ 5.0% - 5.5% ] 5.47% | 308,022 | 40.5% |
[ 5.5% - 6.0% ] 5.97% | 291,146 | 43.1% |
[ 6.0% - 6.5% ] 6.41% | 153,678 | 40.2% |
[ 6.5% - 7.0% ] 6.95% | 36,630 | 45.2% |
[ 7.0% - 7.5% ] 7.41% | 48,379 | 43.9% |
[ 7.5% - 8.0% ] 7.84% | 61,586 | 57.4% |
[ 8.0% - 8.5% ] 8.38% | 17,826 | 43.3% |
[ 8.5% - 9.0% ] 8.79% | 23,158 | 51.1% |
[ 9.0% - 9.5% ] 9.30% | 12,069 | 50.6% |
[ 9.5% - 10.0% ] 9.76% | 17,410 | 53.2% |
[ 10.0% - 10.5% ] 10.26% | 53,332 | 35.3% |
[ 10.5% - 11.0% ] 10.71% | 14,039 | 49.3% |
[ 11.0% - 11.5% ] 11.14% | 18,245 | 48.2% |
[ 11.5% - 12.0% ] 11.90% | 18,069 | 45.3% |
[ 12.0% - 12.5% ] 12.15% | 8,159 | 47.0% |
[ 12.5% - 13.0% ] 12.74% | 2,496 | 44.5% |
[ 13.0% - 13.5% ] 13.18% | 4,157 | 47.4% |
[ 13.5% - 14.0% ] 13.72% | 11,095 | 40.1% |
[ 14.0% - 14.5% ] 14.10% | 1,532 | 55.3% |
[ 14.0% - 14.5% ] 14.48% | 6,733 | 51.0% |
[ 15.0% - 15.5% ] 15.05% | 8,088 | 46.6% |
[ 15.5% - 16.0% ] 15.52% | 1,740 | 26.0% |
[ 16.0% - 16.5% ] 16.03% | 1,578 | 41.1% |
[ 16.5% - 17.0% ] 16.54% | 2,817 | 49.6% |
[ 16.5% - 17.0% ] 16.90% | 1,852 | 31.5% |
[ 17.0% - 17.5% ] 17.36% | 1,567 | 54.8% |
[ 17.5% - 18.0% ] 17.94% | 4,761 | 36.4% |
[ 18.0% - 18.5% ] 18.32% | 2,336 | 41.2% |
[ 18.5% - 19.0% ] 18.76% | 10,722 | 29.6% |
[ 19.0% - 19.5% ] 19.21% | 2,889 | 55.0% |
[ 19.5% - 20.0% ] 19.76% | 1,189 | 16.7% |
[ 20.5% - 21.0% ] 20.51% | 156 | 60.7% |
[ 20.5% - 21.0% ] 20.62% | 20,910 | 34.6% |
[ 21.0% - 21.5% ] 21.48% | 2,179 | 51.0% |
[ 22.0% - 22.5% ] 22.37% | 4,650 | 34.2% |
[ 22.5% - 23.0% ] 22.59% | 3,285 | 50.2% |
[ 23.0% - 23.5% ] 23.23% | 6,280 | 48.2% |
[ 23.0% - 23.5% ] 23.48% | 115 | 4.0% |
[ 24.5% - 25.0% ] 24.66% | 1,168 | 39.1% |
[ 25.5% - 26.0% ] 25.56% | 360 | 34.3% |
[ 26.5% - 27.0% ] 26.65% | 2,233 | 34.0% |
[ 29.0% - 29.5% ] 29.29% | 239 | 42.2% |
[ 30.5% - 31.0% ] 30.82% | 1,684 | 42.1% |
[ 31.0% - 31.5% ] 31.22% | 1,864 | 30.4% |
[ 32.5% - 33.0% ] 32.97% | 185 | 50.0% |
[ 33.0% - 33.5% ] 33.07% | 127 | 39.1% |
[ 34.5% - 35.0% ] 34.83% | 201 | 56.5% |
[ 37.0% - 37.5% ] 37.01% | 589 | 8.1% |
[ 40.5% - 41.0% ] 40.69% | 1,504 | 63.0% |
[ 41.5% - 42.0% ] 41.66% | 797 | 28.3% |
[ 44.0% - 44.5% ] 44.26% | 2,212 | 63.8% |
[ 45.0% - 45.5% ] 45.30% | 1,786 | 28.8% |
[ 47.0% - 47.5% ] 47.19% | 1,549 | 47.1% |
[ 47.0% - 47.5% ] 47.44% | 1,541 | 47.3% |
[ 49.0% - 49.5% ] 49.06% | 530 | 80.0% |
[ 49.0% - 49.5% ] 49.29% | 211 | 47.0% |
[ 50.0% - 50.5% ] 50.00% | 82 | 9.8% |
[ 51.5% - 52.0% ] 51.87% | 2,215 | 16.8% |
[ 56.5% - 57.0% ] 56.66% | 413 | 58.6% |
[ 60.0% - 60.5% ] 60.11% | 371 | 86.4% |
[ 73.5% - 74.0% ] 73.70% | 540 | 75.7% |
[ 78.5% - 79.0% ] 78.89% | 199 | 100.0% |
[ 95.5% - 96.0% ] 95.61% | 433 | 48.1% |