Spaniard 4 or more Vehicles in Household
COMPARE
Spaniard
Select to Compare
4 or more Vehicles in Household
Spaniard 4 or more Vehicles in Household
7.6%
4+ VEHICLES AVAILABLE
100.0/ 100
METRIC RATING
60th/ 347
METRIC RANK
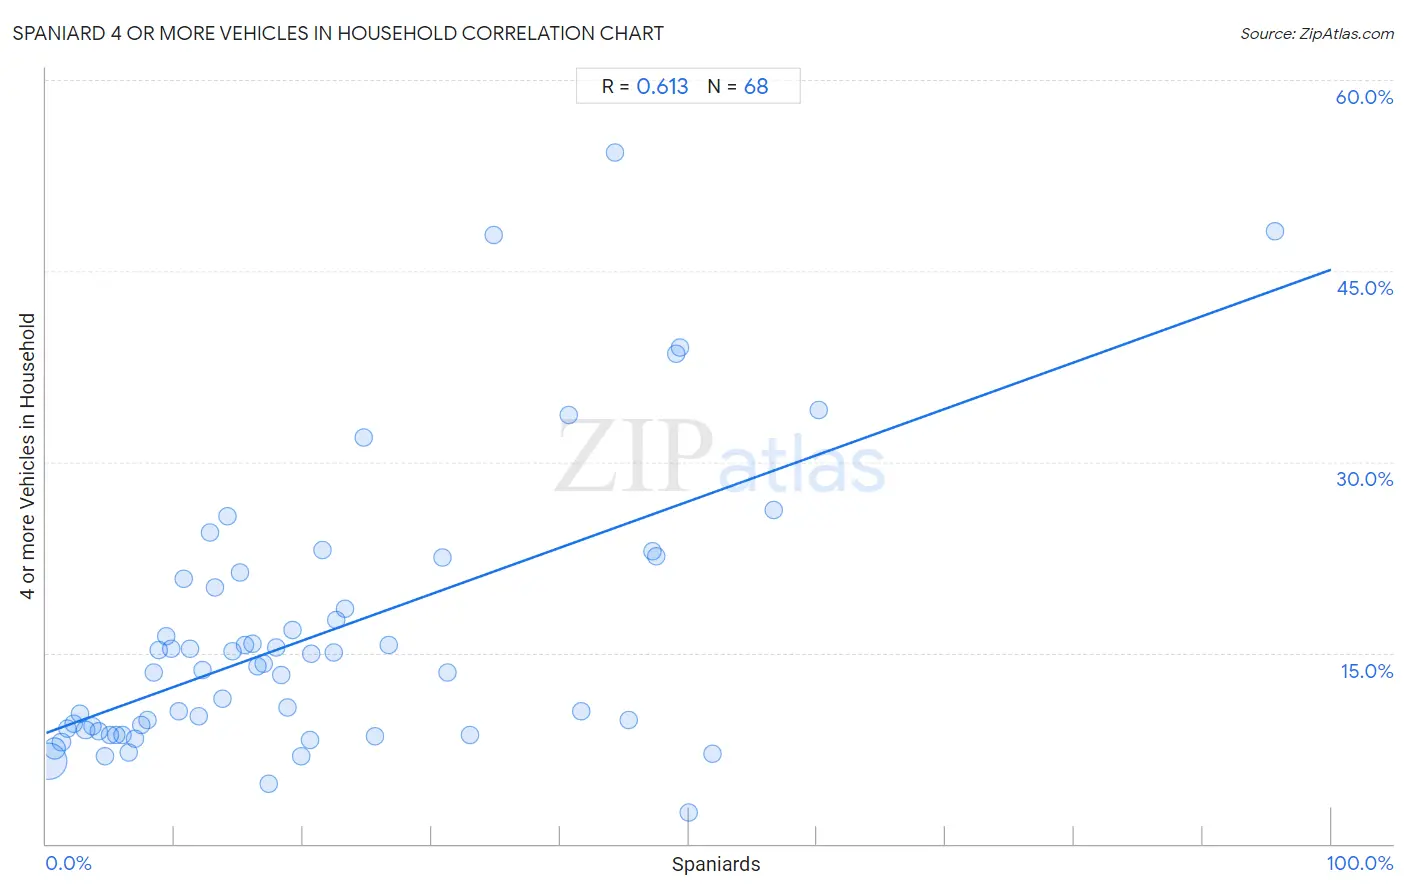
Spaniard 4 or more Vehicles in Household Correlation Chart
The statistical analysis conducted on geographies consisting of 441,319,391 people shows a significant positive correlation between the proportion of Spaniards and percentage of households with 4 or more vehicles available in the United States with a correlation coefficient (R) of 0.613 and weighted average of 7.6%. On average, for every 1% (one percent) increase in Spaniards within a typical geography, there is an increase of 0.36% in percentage of households with 4 or more vehicles available.
It is essential to understand that the correlation between the percentage of Spaniards and percentage of households with 4 or more vehicles available does not imply a direct cause-and-effect relationship. It remains uncertain whether the presence of Spaniards influences an upward or downward trend in the level of percentage of households with 4 or more vehicles available within an area, or if Spaniards simply ended up residing in those areas with higher or lower levels of percentage of households with 4 or more vehicles available due to other factors.
Demographics Similar to Spaniards by 4 or more Vehicles in Household
In terms of 4 or more vehicles in household, the demographic groups most similar to Spaniards are Hispanic or Latino (7.6%, a difference of 0.060%), Pennsylvania German (7.6%, a difference of 0.10%), Swedish (7.6%, a difference of 0.10%), English (7.6%, a difference of 0.22%), and Immigrants from Oceania (7.6%, a difference of 0.24%).
| Demographics | Rating | Rank | 4 or more Vehicles in Household |
| Malaysians | 100.0 /100 | #53 | Exceptional 7.7% |
| Dutch | 100.0 /100 | #54 | Exceptional 7.7% |
| Immigrants from Oceania | 100.0 /100 | #55 | Exceptional 7.6% |
| English | 100.0 /100 | #56 | Exceptional 7.6% |
| Pennsylvania Germans | 100.0 /100 | #57 | Exceptional 7.6% |
| Swedes | 100.0 /100 | #58 | Exceptional 7.6% |
| Hispanics or Latinos | 100.0 /100 | #59 | Exceptional 7.6% |
| Spaniards | 100.0 /100 | #60 | Exceptional 7.6% |
| Europeans | 100.0 /100 | #61 | Exceptional 7.6% |
| Chippewa | 100.0 /100 | #62 | Exceptional 7.6% |
| Immigrants from Micronesia | 100.0 /100 | #63 | Exceptional 7.6% |
| Bangladeshis | 100.0 /100 | #64 | Exceptional 7.6% |
| Immigrants from the Azores | 100.0 /100 | #65 | Exceptional 7.5% |
| Immigrants from Taiwan | 99.9 /100 | #66 | Exceptional 7.5% |
| Americans | 99.9 /100 | #67 | Exceptional 7.5% |
Spaniard 4 or more Vehicles in Household Correlation Summary
| Measurement | Spaniard Data | 4 or more Vehicles in Household Data |
| Minimum | 0.20% | 2.4% |
| Maximum | 95.6% | 54.3% |
| Range | 95.4% | 51.9% |
| Mean | 21.1% | 16.4% |
| Median | 16.3% | 13.8% |
| Interquartile 25% (IQ1) | 8.1% | 8.9% |
| Interquartile 75% (IQ3) | 28.7% | 20.5% |
| Interquartile Range (IQR) | 20.6% | 11.6% |
| Standard Deviation (Sample) | 18.2% | 10.8% |
| Standard Deviation (Population) | 18.1% | 10.7% |
Correlation Details
| Spaniard Percentile | Sample Size | 4 or more Vehicles in Household |
[ 0.0% - 0.5% ] 0.20% | 335,441,947 | 6.5% |
[ 0.5% - 1.0% ] 0.66% | 78,068,066 | 7.5% |
[ 1.0% - 1.5% ] 1.16% | 15,722,201 | 8.0% |
[ 1.5% - 2.0% ] 1.64% | 4,394,187 | 9.0% |
[ 2.0% - 2.5% ] 2.10% | 2,149,016 | 9.4% |
[ 2.5% - 3.0% ] 2.62% | 1,315,510 | 10.3% |
[ 3.0% - 3.5% ] 3.06% | 798,468 | 8.9% |
[ 3.5% - 4.0% ] 3.59% | 517,120 | 9.3% |
[ 4.0% - 4.5% ] 4.04% | 319,773 | 8.8% |
[ 4.5% - 5.0% ] 4.60% | 1,077,813 | 6.8% |
[ 4.5% - 5.0% ] 4.95% | 342,612 | 8.5% |
[ 5.0% - 5.5% ] 5.47% | 302,847 | 8.5% |
[ 5.5% - 6.0% ] 5.97% | 288,981 | 8.5% |
[ 6.0% - 6.5% ] 6.41% | 152,462 | 7.2% |
[ 6.5% - 7.0% ] 6.95% | 34,322 | 8.3% |
[ 7.0% - 7.5% ] 7.42% | 47,611 | 9.4% |
[ 7.5% - 8.0% ] 7.84% | 61,497 | 9.7% |
[ 8.0% - 8.5% ] 8.37% | 15,396 | 13.4% |
[ 8.5% - 9.0% ] 8.79% | 20,712 | 15.2% |
[ 9.0% - 9.5% ] 9.30% | 12,069 | 16.3% |
[ 9.5% - 10.0% ] 9.74% | 16,158 | 15.3% |
[ 10.0% - 10.5% ] 10.26% | 52,272 | 10.4% |
[ 10.5% - 11.0% ] 10.71% | 14,039 | 20.8% |
[ 11.0% - 11.5% ] 11.15% | 17,199 | 15.3% |
[ 11.5% - 12.0% ] 11.90% | 18,069 | 10.0% |
[ 12.0% - 12.5% ] 12.15% | 8,159 | 13.6% |
[ 12.5% - 13.0% ] 12.72% | 338 | 24.5% |
[ 13.0% - 13.5% ] 13.13% | 2,756 | 20.2% |
[ 13.5% - 14.0% ] 13.73% | 10,812 | 11.4% |
[ 14.0% - 14.5% ] 14.10% | 1,532 | 25.7% |
[ 14.0% - 14.5% ] 14.48% | 5,960 | 15.1% |
[ 15.0% - 15.5% ] 15.05% | 7,402 | 21.3% |
[ 15.0% - 15.5% ] 15.44% | 272 | 15.6% |
[ 16.0% - 16.5% ] 16.04% | 1,496 | 15.7% |
[ 16.0% - 16.5% ] 16.48% | 1,062 | 13.9% |
[ 16.5% - 17.0% ] 16.89% | 752 | 14.1% |
[ 17.0% - 17.5% ] 17.36% | 1,567 | 4.7% |
[ 17.5% - 18.0% ] 17.92% | 4,469 | 15.4% |
[ 18.0% - 18.5% ] 18.32% | 2,145 | 13.3% |
[ 18.5% - 19.0% ] 18.76% | 10,722 | 10.7% |
[ 19.0% - 19.5% ] 19.21% | 2,889 | 16.8% |
[ 19.5% - 20.0% ] 19.85% | 262 | 6.9% |
[ 20.5% - 21.0% ] 20.51% | 156 | 8.2% |
[ 20.5% - 21.0% ] 20.61% | 20,254 | 15.0% |
[ 21.0% - 21.5% ] 21.48% | 2,179 | 23.1% |
[ 22.0% - 22.5% ] 22.37% | 4,650 | 15.0% |
[ 22.5% - 23.0% ] 22.59% | 3,285 | 17.6% |
[ 23.0% - 23.5% ] 23.23% | 5,920 | 18.4% |
[ 24.5% - 25.0% ] 24.74% | 667 | 31.9% |
[ 25.5% - 26.0% ] 25.56% | 360 | 8.4% |
[ 26.5% - 27.0% ] 26.65% | 2,233 | 15.6% |
[ 30.5% - 31.0% ] 30.82% | 1,603 | 22.5% |
[ 31.0% - 31.5% ] 31.23% | 1,540 | 13.4% |
[ 32.5% - 33.0% ] 32.97% | 185 | 8.6% |
[ 34.5% - 35.0% ] 34.83% | 201 | 47.8% |
[ 40.5% - 41.0% ] 40.69% | 1,504 | 33.7% |
[ 41.5% - 42.0% ] 41.66% | 797 | 10.4% |
[ 44.0% - 44.5% ] 44.26% | 2,212 | 54.3% |
[ 45.0% - 45.5% ] 45.30% | 1,786 | 9.7% |
[ 47.0% - 47.5% ] 47.19% | 1,549 | 23.0% |
[ 47.0% - 47.5% ] 47.44% | 1,541 | 22.6% |
[ 48.5% - 49.0% ] 49.00% | 249 | 38.5% |
[ 49.0% - 49.5% ] 49.29% | 211 | 39.0% |
[ 50.0% - 50.5% ] 50.00% | 82 | 2.4% |
[ 51.5% - 52.0% ] 51.89% | 2,068 | 7.1% |
[ 56.5% - 57.0% ] 56.66% | 413 | 26.2% |
[ 60.0% - 60.5% ] 60.11% | 371 | 34.1% |
[ 95.5% - 96.0% ] 95.61% | 433 | 48.1% |