Spaniard GED/Equivalency
COMPARE
Spaniard
Select to Compare
GED/Equivalency
Spaniard GED/Equivalency
85.4%
GED/EQUIVALENCY
31.9/ 100
METRIC RATING
186th/ 347
METRIC RANK
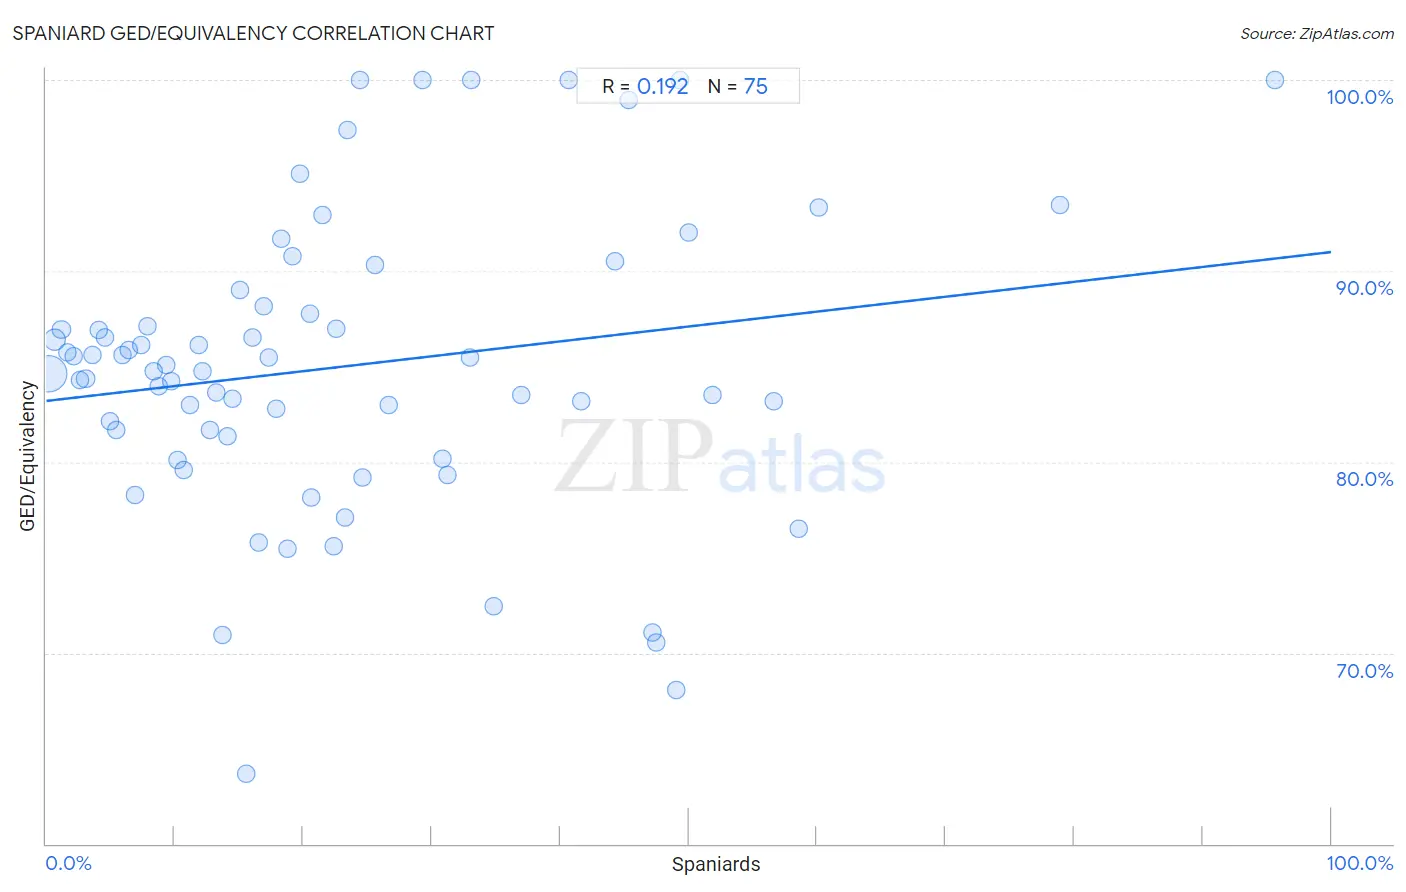
Spaniard GED/Equivalency Correlation Chart
The statistical analysis conducted on geographies consisting of 443,545,703 people shows a poor positive correlation between the proportion of Spaniards and percentage of population with at least ged/equivalency education in the United States with a correlation coefficient (R) of 0.192 and weighted average of 85.4%. On average, for every 1% (one percent) increase in Spaniards within a typical geography, there is an increase of 0.078% in percentage of population with at least ged/equivalency education.
It is essential to understand that the correlation between the percentage of Spaniards and percentage of population with at least ged/equivalency education does not imply a direct cause-and-effect relationship. It remains uncertain whether the presence of Spaniards influences an upward or downward trend in the level of percentage of population with at least ged/equivalency education within an area, or if Spaniards simply ended up residing in those areas with higher or lower levels of percentage of population with at least ged/equivalency education due to other factors.
Demographics Similar to Spaniards by GED/Equivalency
In terms of ged/equivalency, the demographic groups most similar to Spaniards are Spanish (85.4%, a difference of 0.020%), Immigrants from Oceania (85.5%, a difference of 0.040%), Immigrants from Sudan (85.5%, a difference of 0.050%), Immigrants from Afghanistan (85.4%, a difference of 0.050%), and Sudanese (85.5%, a difference of 0.070%).
| Demographics | Rating | Rank | GED/Equivalency |
| Aleuts | 40.5 /100 | #179 | Average 85.6% |
| Immigrants from Southern Europe | 38.4 /100 | #180 | Fair 85.5% |
| Moroccans | 37.7 /100 | #181 | Fair 85.5% |
| Sudanese | 35.2 /100 | #182 | Fair 85.5% |
| Immigrants from Sudan | 34.2 /100 | #183 | Fair 85.5% |
| Immigrants from Oceania | 33.6 /100 | #184 | Fair 85.5% |
| Spanish | 32.8 /100 | #185 | Fair 85.4% |
| Spaniards | 31.9 /100 | #186 | Fair 85.4% |
| Immigrants from Afghanistan | 29.8 /100 | #187 | Fair 85.4% |
| Immigrants from Sierra Leone | 29.0 /100 | #188 | Fair 85.4% |
| Guamanians/Chamorros | 28.4 /100 | #189 | Fair 85.3% |
| Alaskan Athabascans | 27.5 /100 | #190 | Fair 85.3% |
| South American Indians | 22.8 /100 | #191 | Fair 85.2% |
| Nonimmigrants | 22.7 /100 | #192 | Fair 85.2% |
| Delaware | 22.2 /100 | #193 | Fair 85.2% |
Spaniard GED/Equivalency Correlation Summary
| Measurement | Spaniard Data | GED/Equivalency Data |
| Minimum | 0.20% | 63.6% |
| Maximum | 95.6% | 100.0% |
| Range | 95.4% | 36.4% |
| Mean | 23.0% | 85.0% |
| Median | 17.9% | 84.7% |
| Interquartile 25% (IQ1) | 8.8% | 81.4% |
| Interquartile 75% (IQ3) | 33.0% | 88.2% |
| Interquartile Range (IQR) | 24.2% | 6.8% |
| Standard Deviation (Sample) | 19.1% | 7.8% |
| Standard Deviation (Population) | 19.0% | 7.7% |
Correlation Details
| Spaniard Percentile | Sample Size | GED/Equivalency |
[ 0.0% - 0.5% ] 0.20% | 336,750,557 | 84.6% |
[ 0.5% - 1.0% ] 0.66% | 78,495,871 | 86.4% |
[ 1.0% - 1.5% ] 1.15% | 15,950,378 | 86.9% |
[ 1.5% - 2.0% ] 1.65% | 4,507,247 | 85.7% |
[ 2.0% - 2.5% ] 2.10% | 2,197,945 | 85.5% |
[ 2.5% - 3.0% ] 2.62% | 1,328,269 | 84.3% |
[ 3.0% - 3.5% ] 3.06% | 814,102 | 84.3% |
[ 3.5% - 4.0% ] 3.59% | 542,199 | 85.6% |
[ 4.0% - 4.5% ] 4.04% | 321,911 | 86.9% |
[ 4.5% - 5.0% ] 4.60% | 1,081,576 | 86.5% |
[ 4.5% - 5.0% ] 4.95% | 345,441 | 82.1% |
[ 5.0% - 5.5% ] 5.47% | 308,814 | 81.7% |
[ 5.5% - 6.0% ] 5.97% | 292,138 | 85.6% |
[ 6.0% - 6.5% ] 6.41% | 153,678 | 85.9% |
[ 6.5% - 7.0% ] 6.95% | 36,701 | 78.3% |
[ 7.0% - 7.5% ] 7.41% | 48,379 | 86.1% |
[ 7.5% - 8.0% ] 7.84% | 62,101 | 87.1% |
[ 8.0% - 8.5% ] 8.38% | 17,826 | 84.7% |
[ 8.5% - 9.0% ] 8.79% | 23,158 | 84.0% |
[ 9.0% - 9.5% ] 9.30% | 12,069 | 85.1% |
[ 9.5% - 10.0% ] 9.76% | 17,410 | 84.2% |
[ 10.0% - 10.5% ] 10.26% | 53,332 | 80.1% |
[ 10.5% - 11.0% ] 10.71% | 14,039 | 79.6% |
[ 11.0% - 11.5% ] 11.14% | 18,245 | 83.0% |
[ 11.5% - 12.0% ] 11.90% | 18,069 | 86.2% |
[ 12.0% - 12.5% ] 12.15% | 8,159 | 84.7% |
[ 12.5% - 13.0% ] 12.74% | 2,496 | 81.7% |
[ 13.0% - 13.5% ] 13.18% | 4,157 | 83.6% |
[ 13.5% - 14.0% ] 13.72% | 11,095 | 70.9% |
[ 14.0% - 14.5% ] 14.10% | 1,532 | 81.4% |
[ 14.0% - 14.5% ] 14.48% | 6,733 | 83.3% |
[ 15.0% - 15.5% ] 15.05% | 8,088 | 89.0% |
[ 15.5% - 16.0% ] 15.52% | 1,740 | 63.6% |
[ 16.0% - 16.5% ] 16.03% | 1,578 | 86.5% |
[ 16.5% - 17.0% ] 16.54% | 2,817 | 75.8% |
[ 16.5% - 17.0% ] 16.90% | 1,852 | 88.2% |
[ 17.0% - 17.5% ] 17.36% | 1,567 | 85.4% |
[ 17.5% - 18.0% ] 17.94% | 4,761 | 82.8% |
[ 18.0% - 18.5% ] 18.32% | 2,336 | 91.7% |
[ 18.5% - 19.0% ] 18.76% | 10,722 | 75.4% |
[ 19.0% - 19.5% ] 19.21% | 2,889 | 90.8% |
[ 19.5% - 20.0% ] 19.76% | 1,189 | 95.1% |
[ 20.5% - 21.0% ] 20.51% | 156 | 87.8% |
[ 20.5% - 21.0% ] 20.62% | 20,910 | 78.1% |
[ 21.0% - 21.5% ] 21.48% | 2,179 | 93.0% |
[ 22.0% - 22.5% ] 22.37% | 4,650 | 75.6% |
[ 22.5% - 23.0% ] 22.59% | 3,285 | 86.9% |
[ 23.0% - 23.5% ] 23.23% | 6,280 | 77.1% |
[ 23.0% - 23.5% ] 23.48% | 115 | 97.4% |
[ 24.0% - 24.5% ] 24.38% | 242 | 100.0% |
[ 24.5% - 25.0% ] 24.66% | 1,168 | 79.2% |
[ 25.5% - 26.0% ] 25.56% | 360 | 90.3% |
[ 26.5% - 27.0% ] 26.65% | 2,233 | 83.0% |
[ 29.0% - 29.5% ] 29.29% | 239 | 100.0% |
[ 30.5% - 31.0% ] 30.82% | 1,684 | 80.2% |
[ 31.0% - 31.5% ] 31.22% | 1,864 | 79.3% |
[ 32.5% - 33.0% ] 32.97% | 185 | 85.5% |
[ 33.0% - 33.5% ] 33.07% | 127 | 100.0% |
[ 34.5% - 35.0% ] 34.83% | 201 | 72.4% |
[ 37.0% - 37.5% ] 37.01% | 589 | 83.5% |
[ 40.5% - 41.0% ] 40.69% | 1,504 | 100.0% |
[ 41.5% - 42.0% ] 41.66% | 797 | 83.1% |
[ 44.0% - 44.5% ] 44.26% | 2,212 | 90.5% |
[ 45.0% - 45.5% ] 45.30% | 1,786 | 98.9% |
[ 47.0% - 47.5% ] 47.19% | 1,549 | 71.1% |
[ 47.0% - 47.5% ] 47.44% | 1,541 | 70.5% |
[ 49.0% - 49.5% ] 49.06% | 530 | 68.0% |
[ 49.0% - 49.5% ] 49.29% | 211 | 100.0% |
[ 50.0% - 50.5% ] 50.00% | 82 | 92.0% |
[ 51.5% - 52.0% ] 51.87% | 2,215 | 83.5% |
[ 56.5% - 57.0% ] 56.66% | 413 | 83.2% |
[ 58.5% - 59.0% ] 58.59% | 227 | 76.5% |
[ 60.0% - 60.5% ] 60.11% | 371 | 93.3% |
[ 78.5% - 79.0% ] 78.89% | 199 | 93.5% |
[ 95.5% - 96.0% ] 95.61% | 433 | 100.0% |