Spaniard Female Disability
COMPARE
Spaniard
Select to Compare
Female Disability
Spaniard Female Disability
12.8%
DISABILITY | FEMALES
0.7/ 100
METRIC RATING
263rd/ 347
METRIC RANK
Spaniard Female Disability Correlation Chart
The statistical analysis conducted on geographies consisting of 443,418,073 people shows a substantial positive correlation between the proportion of Spaniards and percentage of females with a disability in the United States with a correlation coefficient (R) of 0.541 and weighted average of 12.8%. On average, for every 1% (one percent) increase in Spaniards within a typical geography, there is an increase of 0.37% in percentage of females with a disability.
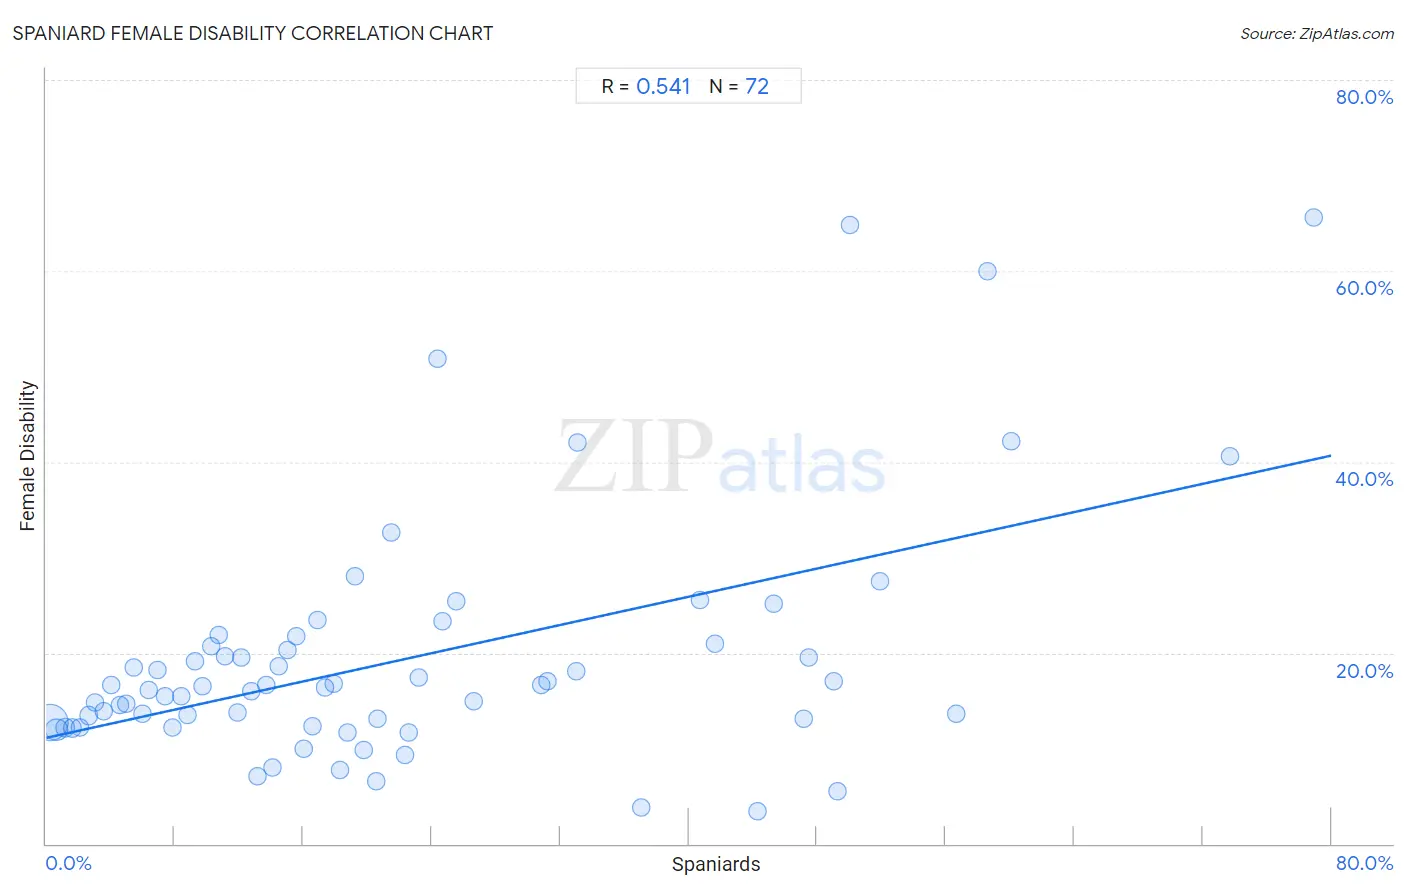
It is essential to understand that the correlation between the percentage of Spaniards and percentage of females with a disability does not imply a direct cause-and-effect relationship. It remains uncertain whether the presence of Spaniards influences an upward or downward trend in the level of percentage of females with a disability within an area, or if Spaniards simply ended up residing in those areas with higher or lower levels of percentage of females with a disability due to other factors.
Demographics Similar to Spaniards by Female Disability
In terms of female disability, the demographic groups most similar to Spaniards are Alaska Native (12.8%, a difference of 0.12%), Czechoslovakian (12.7%, a difference of 0.23%), Bermudan (12.7%, a difference of 0.30%), West Indian (12.8%, a difference of 0.31%), and Subsaharan African (12.7%, a difference of 0.34%).
| Demographics | Rating | Rank | Female Disability |
| British West Indians | 1.2 /100 | #256 | Tragic 12.7% |
| Liberians | 1.1 /100 | #257 | Tragic 12.7% |
| Aleuts | 1.1 /100 | #258 | Tragic 12.7% |
| Immigrants from Armenia | 1.0 /100 | #259 | Tragic 12.7% |
| Sub-Saharan Africans | 1.0 /100 | #260 | Tragic 12.7% |
| Bermudans | 1.0 /100 | #261 | Tragic 12.7% |
| Czechoslovakians | 0.9 /100 | #262 | Tragic 12.7% |
| Spaniards | 0.7 /100 | #263 | Tragic 12.8% |
| Alaska Natives | 0.6 /100 | #264 | Tragic 12.8% |
| West Indians | 0.5 /100 | #265 | Tragic 12.8% |
| Finns | 0.4 /100 | #266 | Tragic 12.8% |
| Senegalese | 0.4 /100 | #267 | Tragic 12.8% |
| Immigrants from Laos | 0.4 /100 | #268 | Tragic 12.8% |
| Indonesians | 0.4 /100 | #269 | Tragic 12.8% |
| Immigrants from Liberia | 0.3 /100 | #270 | Tragic 12.9% |
Spaniard Female Disability Correlation Summary
| Measurement | Spaniard Data | Female Disability Data |
| Minimum | 0.20% | 3.4% |
| Maximum | 78.9% | 65.6% |
| Range | 78.7% | 62.2% |
| Mean | 22.4% | 19.4% |
| Median | 17.1% | 16.4% |
| Interquartile 25% (IQ1) | 8.6% | 12.5% |
| Interquartile 75% (IQ3) | 32.1% | 20.8% |
| Interquartile Range (IQR) | 23.5% | 8.3% |
| Standard Deviation (Sample) | 18.5% | 12.6% |
| Standard Deviation (Population) | 18.3% | 12.5% |
Correlation Details
| Spaniard Percentile | Sample Size | Female Disability |
[ 0.0% - 0.5% ] 0.20% | 336,726,329 | 12.7% |
[ 0.5% - 1.0% ] 0.66% | 78,437,547 | 11.9% |
[ 1.0% - 1.5% ] 1.15% | 15,926,214 | 12.2% |
[ 1.5% - 2.0% ] 1.65% | 4,506,317 | 12.1% |
[ 2.0% - 2.5% ] 2.10% | 2,194,323 | 12.2% |
[ 2.5% - 3.0% ] 2.62% | 1,324,285 | 13.4% |
[ 3.0% - 3.5% ] 3.06% | 814,038 | 14.7% |
[ 3.5% - 4.0% ] 3.59% | 540,574 | 13.9% |
[ 4.0% - 4.5% ] 4.04% | 321,587 | 16.7% |
[ 4.5% - 5.0% ] 4.60% | 1,081,576 | 14.5% |
[ 4.5% - 5.0% ] 4.95% | 344,803 | 14.7% |
[ 5.0% - 5.5% ] 5.47% | 307,561 | 18.5% |
[ 5.5% - 6.0% ] 5.97% | 291,935 | 13.6% |
[ 6.0% - 6.5% ] 6.41% | 153,678 | 16.1% |
[ 6.5% - 7.0% ] 6.95% | 36,701 | 18.2% |
[ 7.0% - 7.5% ] 7.42% | 48,157 | 15.5% |
[ 7.5% - 8.0% ] 7.84% | 61,240 | 12.2% |
[ 8.0% - 8.5% ] 8.37% | 17,636 | 15.4% |
[ 8.5% - 9.0% ] 8.79% | 22,938 | 13.4% |
[ 9.0% - 9.5% ] 9.30% | 11,754 | 19.1% |
[ 9.5% - 10.0% ] 9.76% | 17,109 | 16.5% |
[ 10.0% - 10.5% ] 10.26% | 53,332 | 20.7% |
[ 10.5% - 11.0% ] 10.71% | 14,039 | 21.9% |
[ 11.0% - 11.5% ] 11.15% | 17,612 | 19.6% |
[ 11.5% - 12.0% ] 11.90% | 18,069 | 13.8% |
[ 12.0% - 12.5% ] 12.16% | 7,435 | 19.6% |
[ 12.5% - 13.0% ] 12.74% | 2,496 | 16.0% |
[ 13.0% - 13.5% ] 13.17% | 3,334 | 7.1% |
[ 13.5% - 14.0% ] 13.72% | 11,095 | 16.7% |
[ 14.0% - 14.5% ] 14.10% | 1,532 | 8.0% |
[ 14.0% - 14.5% ] 14.44% | 5,866 | 18.6% |
[ 15.0% - 15.5% ] 15.05% | 7,906 | 20.3% |
[ 15.5% - 16.0% ] 15.57% | 591 | 21.7% |
[ 16.0% - 16.5% ] 16.03% | 1,578 | 10.0% |
[ 16.5% - 17.0% ] 16.54% | 2,817 | 12.3% |
[ 16.5% - 17.0% ] 16.91% | 1,703 | 23.4% |
[ 17.0% - 17.5% ] 17.36% | 1,567 | 16.3% |
[ 17.5% - 18.0% ] 17.94% | 4,761 | 16.8% |
[ 18.0% - 18.5% ] 18.31% | 2,065 | 7.7% |
[ 18.5% - 19.0% ] 18.76% | 10,722 | 11.6% |
[ 19.0% - 19.5% ] 19.21% | 2,889 | 28.0% |
[ 19.5% - 20.0% ] 19.73% | 902 | 9.8% |
[ 20.5% - 21.0% ] 20.51% | 156 | 6.6% |
[ 20.5% - 21.0% ] 20.62% | 20,910 | 13.1% |
[ 21.0% - 21.5% ] 21.48% | 2,179 | 32.6% |
[ 22.0% - 22.5% ] 22.37% | 4,650 | 9.3% |
[ 22.5% - 23.0% ] 22.59% | 3,285 | 11.6% |
[ 23.0% - 23.5% ] 23.23% | 5,920 | 17.4% |
[ 24.0% - 24.5% ] 24.38% | 242 | 50.8% |
[ 24.5% - 25.0% ] 24.66% | 1,168 | 23.3% |
[ 25.5% - 26.0% ] 25.56% | 360 | 25.4% |
[ 26.5% - 27.0% ] 26.65% | 2,165 | 14.9% |
[ 30.5% - 31.0% ] 30.82% | 1,684 | 16.7% |
[ 31.0% - 31.5% ] 31.22% | 1,864 | 17.0% |
[ 32.5% - 33.0% ] 32.97% | 185 | 18.1% |
[ 33.0% - 33.5% ] 33.07% | 127 | 42.0% |
[ 37.0% - 37.5% ] 37.01% | 589 | 3.8% |
[ 40.5% - 41.0% ] 40.69% | 1,504 | 25.5% |
[ 41.5% - 42.0% ] 41.66% | 797 | 21.0% |
[ 44.0% - 44.5% ] 44.25% | 2,158 | 3.4% |
[ 45.0% - 45.5% ] 45.30% | 1,786 | 25.2% |
[ 47.0% - 47.5% ] 47.19% | 1,549 | 13.0% |
[ 47.0% - 47.5% ] 47.44% | 1,541 | 19.5% |
[ 49.0% - 49.5% ] 49.06% | 530 | 17.0% |
[ 49.0% - 49.5% ] 49.29% | 211 | 5.4% |
[ 50.0% - 50.5% ] 50.00% | 82 | 64.8% |
[ 51.5% - 52.0% ] 51.89% | 2,068 | 27.5% |
[ 56.5% - 57.0% ] 56.66% | 413 | 13.6% |
[ 58.5% - 59.0% ] 58.59% | 227 | 60.0% |
[ 60.0% - 60.5% ] 60.11% | 371 | 42.2% |
[ 73.5% - 74.0% ] 73.70% | 540 | 40.6% |
[ 78.5% - 79.0% ] 78.89% | 199 | 65.6% |