Osage College, 1 year or more

COMPARE

Osage
Race
Ancestry
AfghanAfricanAlaska NativeAlaskan AthabascanAlbanianAleutAlsatianAmericanApacheArabArapahoArgentineanArmenianAssyrian/Chaldean/SyriacAustralianAustrianBahamianBangladeshiBarbadianBasqueBelgianBelizeanBermudanBhutaneseBlackfeetBolivianBrazilianBritishBritish West IndianBulgarianBurmeseCajunCambodianCanadianCape VerdeanCarpatho RusynCelticCentral AmericanCentral American IndianCherokeeCheyenneChickasawChileanChineseChippewaChoctawColombianColvilleComancheCosta RicanCreeCreekCroatianCrowCubanCypriotCzechCzechoslovakianDanishDelawareDominicanDutchDutch West IndianEastern EuropeanEcuadorianEgyptianEnglishEstonianEthiopianEuropeanFijianFilipinoFinnishFrenchFrench American IndianFrench CanadianGermanGerman RussianGhanaianGreekGuamanian/ChamorroGuatemalanGuyaneseHaitianHmongHonduranHopiHoumaHungarianIcelanderIndian (Asian)IndonesianInupiatIranianIraqiIrishIroquoisIsraeliItalianJamaicanJapaneseJordanianKenyanKiowaKoreanLaotianLatvianLebaneseLiberianLithuanianLumbeeLuxembourgerMacedonianMalaysianMalteseMarshalleseMenomineeMexicanMexican American IndianMongolianMoroccanNative HawaiianNavajoNepaleseNew ZealanderNicaraguanNigerianNorthern EuropeanNorwegianOkinawanOsageOttawaPaiutePakistaniPalestinianPanamanianParaguayanPennsylvania GermanPeruvianPimaPolishPortuguesePotawatomiPuebloPuerto RicanPuget Sound SalishRomanianRussianSalvadoranSamoanScandinavianScotch-IrishScottishSeminoleSenegaleseSerbianShoshoneSierra LeoneanSiouxSlavicSlovakSloveneSomaliSouth AfricanSouth AmericanSouth American IndianSoviet UnionSpaniardSpanishSpanish AmericanSpanish American IndianSri LankanSubsaharan AfricanSudaneseSwedishSwissSyrianTaiwaneseThaiTlingit-HaidaTohono O'OdhamTonganTrinidadian and TobagonianTsimshianTurkishU.S. Virgin IslanderUgandanUkrainianUruguayanUteVenezuelanVietnameseWelshWest IndianYakamaYaquiYugoslavianYumanYup'ikZimbabwean
Immigration
NonimmigrantsImmigrantsAfghanistanAfricaAlbaniaArgentinaArmeniaAsiaAustraliaAustriaBahamasBangladeshBarbadosBelarusBelgiumBelizeBoliviaBosnia and HerzegovinaBrazilBulgariaBurma/MyanmarCabo VerdeCambodiaCameroonCanadaCaribbeanCentral AmericaChileChinaColombiaCongoCosta RicaCroatiaCubaCzechoslovakiaDenmarkDominicaDominican RepublicEastern AfricaEastern AsiaEastern EuropeEcuadorEgyptEl SalvadorEnglandEritreaEthiopiaEuropeFijiFranceGermanyGhanaGreeceGrenadaGuatemalaGuyanaHaitiHondurasHong KongHungaryIndiaIndonesiaIranIraqIrelandIsraelItalyJamaicaJapanJordanKazakhstanKenyaKoreaKuwaitLaosLatin AmericaLatviaLebanonLiberiaLithuaniaMalaysiaMexicoMicronesiaMiddle AfricaMoldovaMoroccoNepalNetherlandsNicaraguaNigeriaNorth AmericaNorth MacedoniaNorthern AfricaNorthern EuropeNorwayOceaniaPakistanPanamaPeruPhilippinesPolandPortugalRomaniaRussiaSaudi ArabiaScotlandSenegalSerbiaSierra LeoneSingaporeSomaliaSouth AfricaSouth AmericaSouth Central AsiaSouth Eastern AsiaSouthern EuropeSpainSri LankaSt. Vincent and the GrenadinesSudanSwedenSwitzerlandSyriaTaiwanThailandTrinidad and TobagoTurkeyUgandaUkraineUruguayUzbekistanVenezuelaVietnamWest IndiesWestern AfricaWestern AsiaWestern EuropeYemenZaireZimbabweAzores
Select to Compare
Race
Ancestry
AfghanAfricanAlaska NativeAlaskan AthabascanAlbanianAleutAlsatianAmericanApacheArabArapahoArgentineanArmenianAssyrian/Chaldean/SyriacAustralianAustrianBahamianBangladeshiBarbadianBasqueBelgianBelizeanBermudanBhutaneseBlackfeetBolivianBrazilianBritishBritish West IndianBulgarianBurmeseCajunCambodianCanadianCape VerdeanCarpatho RusynCelticCentral AmericanCentral American IndianCherokeeCheyenneChickasawChileanChineseChippewaChoctawColombianColvilleComancheCosta RicanCreeCreekCroatianCrowCubanCypriotCzechCzechoslovakianDanishDelawareDominicanDutchDutch West IndianEastern EuropeanEcuadorianEgyptianEnglishEstonianEthiopianEuropeanFijianFilipinoFinnishFrenchFrench American IndianFrench CanadianGermanGerman RussianGhanaianGreekGuamanian/ChamorroGuatemalanGuyaneseHaitianHmongHonduranHopiHoumaHungarianIcelanderIndian (Asian)IndonesianInupiatIranianIraqiIrishIroquoisIsraeliItalianJamaicanJapaneseJordanianKenyanKiowaKoreanLaotianLatvianLebaneseLiberianLithuanianLumbeeLuxembourgerMacedonianMalaysianMalteseMarshalleseMenomineeMexicanMexican American IndianMongolianMoroccanNative HawaiianNavajoNepaleseNew ZealanderNicaraguanNigerianNorthern EuropeanNorwegianOkinawanOttawaPaiutePakistaniPalestinianPanamanianParaguayanPennsylvania GermanPeruvianPimaPolishPortuguesePotawatomiPuebloPuerto RicanPuget Sound SalishRomanianRussianSalvadoranSamoanScandinavianScotch-IrishScottishSeminoleSenegaleseSerbianShoshoneSierra LeoneanSiouxSlavicSlovakSloveneSomaliSouth AfricanSouth AmericanSouth American IndianSoviet UnionSpaniardSpanishSpanish AmericanSpanish American IndianSri LankanSubsaharan AfricanSudaneseSwedishSwissSyrianTaiwaneseThaiTlingit-HaidaTohono O'OdhamTonganTrinidadian and TobagonianTsimshianTurkishU.S. Virgin IslanderUgandanUkrainianUruguayanUteVenezuelanVietnameseWelshWest IndianYakamaYaquiYugoslavianYumanYup'ikZimbabwean
Immigration
NonimmigrantsImmigrantsAfghanistanAfricaAlbaniaArgentinaArmeniaAsiaAustraliaAustriaBahamasBangladeshBarbadosBelarusBelgiumBelizeBoliviaBosnia and HerzegovinaBrazilBulgariaBurma/MyanmarCabo VerdeCambodiaCameroonCanadaCaribbeanCentral AmericaChileChinaColombiaCongoCosta RicaCroatiaCubaCzechoslovakiaDenmarkDominicaDominican RepublicEastern AfricaEastern AsiaEastern EuropeEcuadorEgyptEl SalvadorEnglandEritreaEthiopiaEuropeFijiFranceGermanyGhanaGreeceGrenadaGuatemalaGuyanaHaitiHondurasHong KongHungaryIndiaIndonesiaIranIraqIrelandIsraelItalyJamaicaJapanJordanKazakhstanKenyaKoreaKuwaitLaosLatin AmericaLatviaLebanonLiberiaLithuaniaMalaysiaMexicoMicronesiaMiddle AfricaMoldovaMoroccoNepalNetherlandsNicaraguaNigeriaNorth AmericaNorth MacedoniaNorthern AfricaNorthern EuropeNorwayOceaniaPakistanPanamaPeruPhilippinesPolandPortugalRomaniaRussiaSaudi ArabiaScotlandSenegalSerbiaSierra LeoneSingaporeSomaliaSouth AfricaSouth AmericaSouth Central AsiaSouth Eastern AsiaSouthern EuropeSpainSri LankaSt. Vincent and the GrenadinesSudanSwedenSwitzerlandSyriaTaiwanThailandTrinidad and TobagoTurkeyUgandaUkraineUruguayUzbekistanVenezuelaVietnamWest IndiesWestern AfricaWestern AsiaWestern EuropeYemenZaireZimbabweAzores
College, 1 year or more
Income
Poverty
Unemployment
Labor Participation
Family Structure
Vehicle Availability
Education Level
Disability

Osage College, 1 year or more
Tragic

55.8%
COLLEGE, 1 YEAR OR MORE
1.0/ 100
METRIC RATING
243rd/ 347
METRIC RANK

Osage College, 1 year or more Correlation Chart

The statistical analysis conducted on geographies consisting of 91,808,929 people shows a moderate negative correlation between the proportion of Osage and percentage of population with at least college, 1 year or more education in the United States with a correlation coefficient (R) of -0.429 and weighted average of 55.8%. On average, for every 1% (one percent) increase in Osage within a typical geography, there is a decrease of 0.79% in percentage of population with at least college, 1 year or more education.
Osage College, 1 year or more
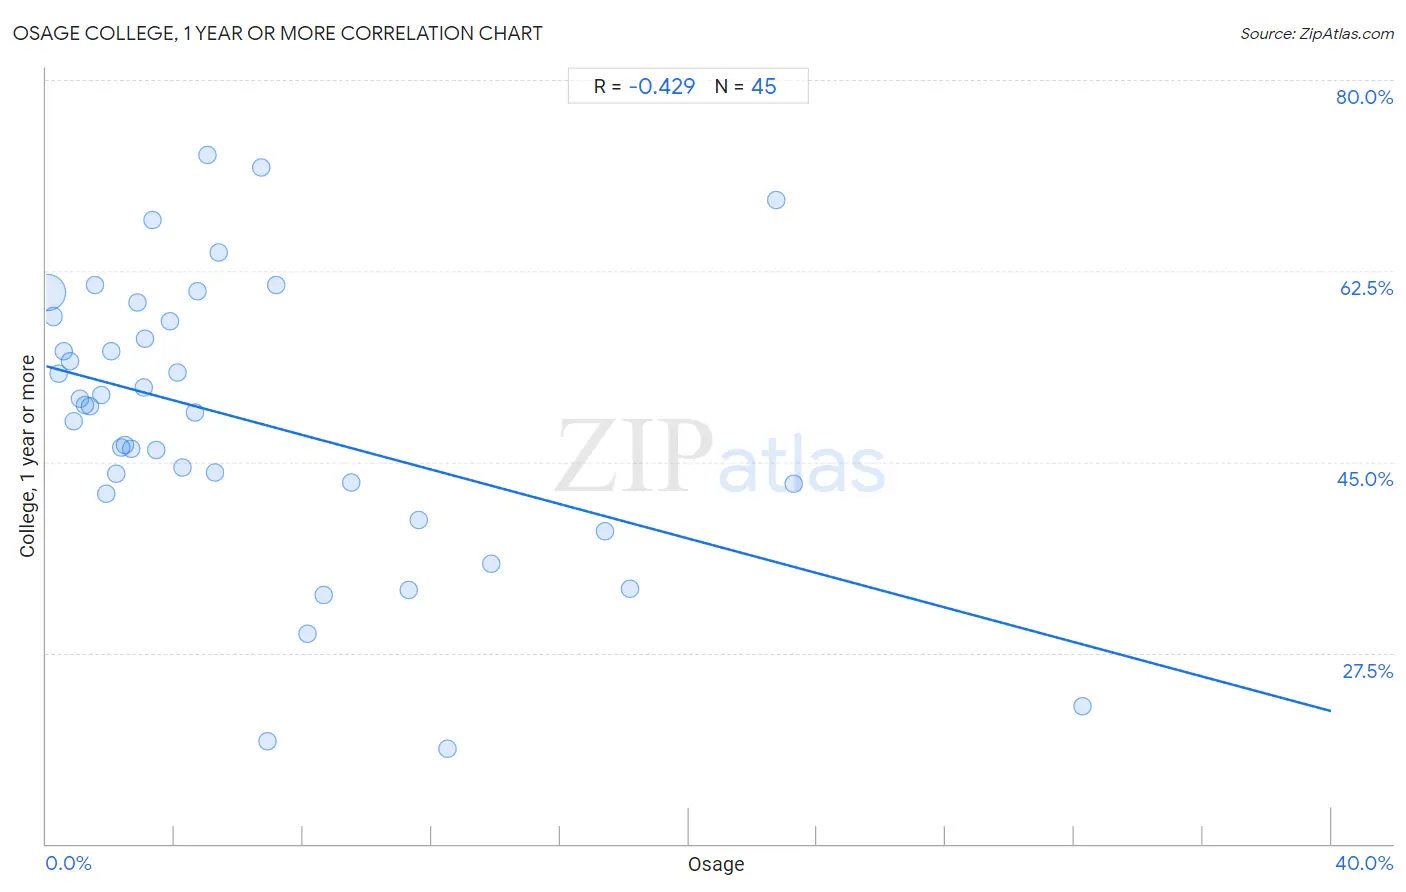
It is essential to understand that the correlation between the percentage of Osage and percentage of population with at least college, 1 year or more education does not imply a direct cause-and-effect relationship. It remains uncertain whether the presence of Osage influences an upward or downward trend in the level of percentage of population with at least college, 1 year or more education within an area, or if Osage simply ended up residing in those areas with higher or lower levels of percentage of population with at least college, 1 year or more education due to other factors.

Demographics Similar to Osage by College, 1 year or more

In terms of college, 1 year or more, the demographic groups most similar to Osage are Marshallese (55.8%, a difference of 0.010%), French American Indian (55.8%, a difference of 0.12%), Chippewa (55.7%, a difference of 0.12%), Trinidadian and Tobagonian (55.8%, a difference of 0.16%), and Immigrants from Liberia (55.7%, a difference of 0.19%).
DemographicsRating | RankCollege, 1 year or more
Iroquois
1.7
/100
|
#236
Tragic
56.2%
Samoans
1.6
/100
|
#237
Tragic
56.2%
Barbadians
1.3
/100
|
#238
Tragic
56.0%
Puget Sound Salish
1.1
/100
|
#239
Tragic
55.9%
Trinidadians and Tobagonians
1.1
/100
|
#240
Tragic
55.8%
French American Indians
1.0
/100
|
#241
Tragic
55.8%
Marshallese
1.0
/100
|
#242
Tragic
55.8%
Osage
1.0
/100
|
#243
Tragic
55.8%
Chippewa
0.9
/100
|
#244
Tragic
55.7%
Immigrants from Liberia
0.8
/100
|
#245
Tragic
55.7%
Malaysians
0.8
/100
|
#246
Tragic
55.6%
Hawaiians
0.8
/100
|
#247
Tragic
55.6%
Immigrants from Congo
0.8
/100
|
#248
Tragic
55.6%
Immigrants from Trinidad and Tobago
0.7
/100
|
#249
Tragic
55.5%
Delaware
0.7
/100
|
#250
Tragic
55.5%

Osage College, 1 year or more Correlation Summary

MeasurementOsage DataCollege, 1 year or more Data
Minimum0.021%18.8%
Maximum32.3%73.1%
Range32.2%54.3%
Mean6.4%48.7%
Median3.8%50.1%
Interquartile 25% (IQ1)1.8%42.6%
Interquartile 75% (IQ3)8.4%58.1%
Interquartile Range (IQR)6.6%15.5%
Standard Deviation (Sample)7.0%12.9%
Standard Deviation (Population)6.9%12.8%

Correlation Details

Osage PercentileSample SizeCollege, 1 year or more
[
0.0%
-
0.5%
]
0.021%
86,865,41760.5%
[
0.0%
-
0.5%
]
0.23%
3,083,96058.3%
[
0.0%
-
0.5%
]
0.39%
828,67453.1%
[
0.5%
-
1.0%
]
0.55%
259,89555.1%
[
0.5%
-
1.0%
]
0.73%
174,18054.3%
[
0.5%
-
1.0%
]
0.86%
127,05448.7%
[
1.0%
-
1.5%
]
1.04%
159,61950.8%
[
1.0%
-
1.5%
]
1.21%
55,91250.2%
[
1.0%
-
1.5%
]
1.34%
43,05850.1%
[
1.5%
-
2.0%
]
1.51%
26,48761.2%
[
1.5%
-
2.0%
]
1.71%
65,77251.1%
[
1.5%
-
2.0%
]
1.87%
5,81542.1%
[
2.0%
-
2.5%
]
2.04%
21,90955.2%
[
2.0%
-
2.5%
]
2.18%
8,65943.9%
[
2.0%
-
2.5%
]
2.32%
4,01146.3%
[
2.0%
-
2.5%
]
2.46%
1,38446.5%
[
2.5%
-
3.0%
]
2.63%
4,75846.3%
[
2.5%
-
3.0%
]
2.83%
1,09559.6%
[
3.0%
-
3.5%
]
3.03%
6,72751.8%
[
3.0%
-
3.5%
]
3.08%
38956.3%
[
3.0%
-
3.5%
]
3.30%
3,02767.1%
[
3.0%
-
3.5%
]
3.42%
14,99046.1%
[
3.5%
-
4.0%
]
3.84%
1,48657.8%
[
4.0%
-
4.5%
]
4.10%
6,73353.2%
[
4.0%
-
4.5%
]
4.25%
42444.5%
[
4.5%
-
5.0%
]
4.62%
71549.6%
[
4.5%
-
5.0%
]
4.72%
10660.6%
[
5.0%
-
5.5%
]
5.00%
4073.1%
[
5.0%
-
5.5%
]
5.26%
11,83244.1%
[
5.0%
-
5.5%
]
5.38%
9364.2%
[
6.5%
-
7.0%
]
6.70%
89572.0%
[
6.5%
-
7.0%
]
6.90%
8719.4%
[
7.0%
-
7.5%
]
7.17%
1,13061.2%
[
8.0%
-
8.5%
]
8.15%
3,32729.2%
[
8.5%
-
9.0%
]
8.62%
4,14032.8%
[
9.0%
-
9.5%
]
9.48%
2,05843.1%
[
11.0%
-
11.5%
]
11.27%
3,00933.3%
[
11.5%
-
12.0%
]
11.60%
4,90539.7%
[
12.0%
-
12.5%
]
12.50%
1618.8%
[
13.5%
-
14.0%
]
13.84%
1,66235.6%
[
17.0%
-
17.5%
]
17.40%
1,59238.7%
[
18.0%
-
18.5%
]
18.17%
1,17233.4%
[
22.5%
-
23.0%
]
22.72%
49369.0%
[
23.0%
-
23.5%
]
23.26%
12943.0%
[
32.0%
-
32.5%
]
32.26%
9322.6%