Osage Married-couple Households
COMPARE
Osage
Select to Compare
Married-couple Households
Osage Married-couple Households
46.9%
MARRIED-COUPLE HOUSEHOLDS
73.2/ 100
METRIC RATING
159th/ 347
METRIC RANK
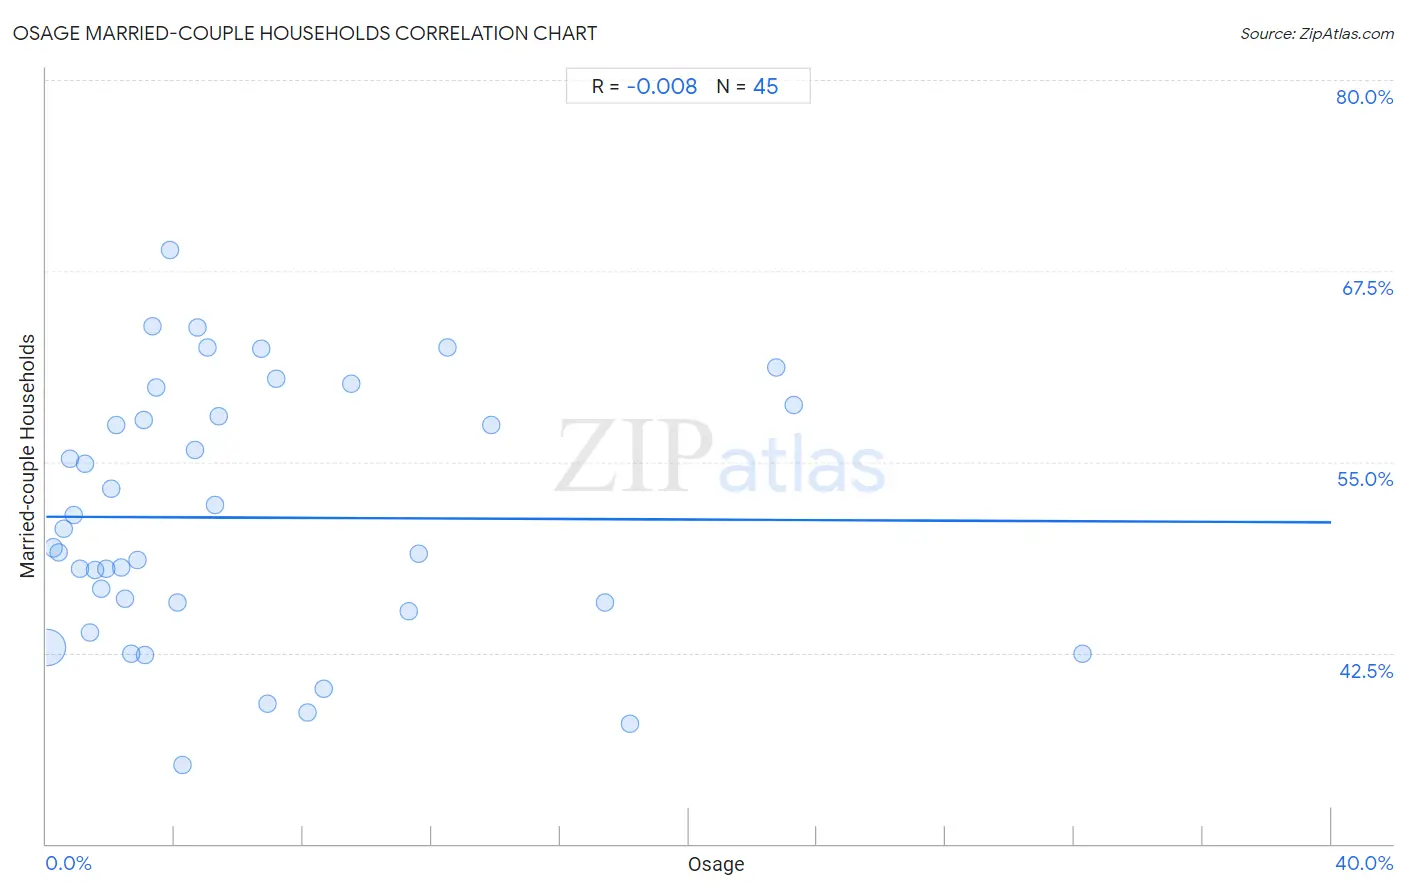
Osage Married-couple Households Correlation Chart
The statistical analysis conducted on geographies consisting of 91,797,548 people shows no correlation between the proportion of Osage and percentage of married-couple family households in the United States with a correlation coefficient (R) of -0.008 and weighted average of 46.9%. On average, for every 1% (one percent) increase in Osage within a typical geography, there is a decrease of 0.0092% in percentage of married-couple family households.
It is essential to understand that the correlation between the percentage of Osage and percentage of married-couple family households does not imply a direct cause-and-effect relationship. It remains uncertain whether the presence of Osage influences an upward or downward trend in the level of percentage of married-couple family households within an area, or if Osage simply ended up residing in those areas with higher or lower levels of percentage of married-couple family households due to other factors.
Demographics Similar to Osage by Married-couple Households
In terms of married-couple households, the demographic groups most similar to Osage are Nonimmigrants (46.9%, a difference of 0.0%), Iraqi (46.9%, a difference of 0.070%), Immigrants from Oceania (46.9%, a difference of 0.080%), Delaware (46.8%, a difference of 0.090%), and Armenian (46.9%, a difference of 0.10%).
| Demographics | Rating | Rank | Married-couple Households |
| Serbians | 76.3 /100 | #152 | Good 47.0% |
| Hmong | 76.2 /100 | #153 | Good 47.0% |
| Immigrants from Western Asia | 76.1 /100 | #154 | Good 46.9% |
| Arabs | 76.0 /100 | #155 | Good 46.9% |
| Armenians | 75.4 /100 | #156 | Good 46.9% |
| Immigrants from Oceania | 74.8 /100 | #157 | Good 46.9% |
| Nonimmigrants | 73.3 /100 | #158 | Good 46.9% |
| Osage | 73.2 /100 | #159 | Good 46.9% |
| Iraqis | 71.7 /100 | #160 | Good 46.9% |
| Delaware | 71.2 /100 | #161 | Good 46.8% |
| Colombians | 71.0 /100 | #162 | Good 46.8% |
| Immigrants from Turkey | 70.2 /100 | #163 | Good 46.8% |
| Immigrants from Kazakhstan | 70.0 /100 | #164 | Good 46.8% |
| Immigrants from Southern Europe | 69.9 /100 | #165 | Good 46.8% |
| Cherokee | 65.7 /100 | #166 | Good 46.7% |
Osage Married-couple Households Correlation Summary
| Measurement | Osage Data | Married-couple Households Data |
| Minimum | 0.021% | 35.1% |
| Maximum | 32.3% | 68.9% |
| Range | 32.2% | 33.8% |
| Mean | 6.4% | 51.3% |
| Median | 3.8% | 49.4% |
| Interquartile 25% (IQ1) | 1.8% | 45.5% |
| Interquartile 75% (IQ3) | 8.4% | 58.3% |
| Interquartile Range (IQR) | 6.6% | 12.9% |
| Standard Deviation (Sample) | 7.0% | 8.3% |
| Standard Deviation (Population) | 6.9% | 8.2% |
Correlation Details
| Osage Percentile | Sample Size | Married-couple Households |
[ 0.0% - 0.5% ] 0.021% | 86,865,417 | 42.8% |
[ 0.0% - 0.5% ] 0.23% | 3,079,340 | 49.4% |
[ 0.0% - 0.5% ] 0.39% | 828,674 | 49.1% |
[ 0.5% - 1.0% ] 0.55% | 253,134 | 50.6% |
[ 0.5% - 1.0% ] 0.73% | 174,180 | 55.2% |
[ 0.5% - 1.0% ] 0.86% | 127,054 | 51.5% |
[ 1.0% - 1.5% ] 1.04% | 159,619 | 48.0% |
[ 1.0% - 1.5% ] 1.21% | 55,912 | 54.9% |
[ 1.0% - 1.5% ] 1.34% | 43,058 | 43.8% |
[ 1.5% - 2.0% ] 1.51% | 26,487 | 47.9% |
[ 1.5% - 2.0% ] 1.71% | 65,772 | 46.7% |
[ 1.5% - 2.0% ] 1.87% | 5,815 | 48.0% |
[ 2.0% - 2.5% ] 2.04% | 21,909 | 53.2% |
[ 2.0% - 2.5% ] 2.18% | 8,659 | 57.4% |
[ 2.0% - 2.5% ] 2.32% | 4,011 | 48.1% |
[ 2.0% - 2.5% ] 2.46% | 1,384 | 46.0% |
[ 2.5% - 3.0% ] 2.63% | 4,758 | 42.4% |
[ 2.5% - 3.0% ] 2.83% | 1,095 | 48.6% |
[ 3.0% - 3.5% ] 3.03% | 6,727 | 57.7% |
[ 3.0% - 3.5% ] 3.08% | 389 | 42.4% |
[ 3.0% - 3.5% ] 3.30% | 3,027 | 63.9% |
[ 3.0% - 3.5% ] 3.42% | 14,990 | 59.9% |
[ 3.5% - 4.0% ] 3.84% | 1,486 | 68.9% |
[ 4.0% - 4.5% ] 4.10% | 6,733 | 45.8% |
[ 4.0% - 4.5% ] 4.25% | 424 | 35.1% |
[ 4.5% - 5.0% ] 4.62% | 715 | 55.8% |
[ 4.5% - 5.0% ] 4.72% | 106 | 63.8% |
[ 5.0% - 5.5% ] 5.00% | 40 | 62.5% |
[ 5.0% - 5.5% ] 5.26% | 11,832 | 52.2% |
[ 5.0% - 5.5% ] 5.38% | 93 | 58.0% |
[ 6.5% - 7.0% ] 6.70% | 895 | 62.4% |
[ 6.5% - 7.0% ] 6.90% | 87 | 39.1% |
[ 7.0% - 7.5% ] 7.17% | 1,130 | 60.5% |
[ 8.0% - 8.5% ] 8.15% | 3,327 | 38.6% |
[ 8.5% - 9.0% ] 8.62% | 4,140 | 40.1% |
[ 9.0% - 9.5% ] 9.48% | 2,058 | 60.2% |
[ 11.0% - 11.5% ] 11.27% | 3,009 | 45.2% |
[ 11.5% - 12.0% ] 11.60% | 4,905 | 49.0% |
[ 12.0% - 12.5% ] 12.50% | 16 | 62.5% |
[ 13.5% - 14.0% ] 13.84% | 1,662 | 57.5% |
[ 17.0% - 17.5% ] 17.40% | 1,592 | 45.8% |
[ 18.0% - 18.5% ] 18.17% | 1,172 | 37.9% |
[ 22.5% - 23.0% ] 22.72% | 493 | 61.2% |
[ 23.0% - 23.5% ] 23.26% | 129 | 58.7% |
[ 32.0% - 32.5% ] 32.26% | 93 | 42.4% |