Osage Wage/Income Gap

COMPARE

Osage
Race
Ancestry
AfghanAfricanAlaska NativeAlaskan AthabascanAlbanianAleutAlsatianAmericanApacheArabArapahoArgentineanArmenianAssyrian/Chaldean/SyriacAustralianAustrianBahamianBangladeshiBarbadianBasqueBelgianBelizeanBermudanBhutaneseBlackfeetBolivianBrazilianBritishBritish West IndianBulgarianBurmeseCajunCambodianCanadianCape VerdeanCarpatho RusynCelticCentral AmericanCentral American IndianCherokeeCheyenneChickasawChileanChineseChippewaChoctawColombianColvilleComancheCosta RicanCreeCreekCroatianCrowCubanCypriotCzechCzechoslovakianDanishDelawareDominicanDutchDutch West IndianEastern EuropeanEcuadorianEgyptianEnglishEstonianEthiopianEuropeanFijianFilipinoFinnishFrenchFrench American IndianFrench CanadianGermanGerman RussianGhanaianGreekGuamanian/ChamorroGuatemalanGuyaneseHaitianHmongHonduranHopiHoumaHungarianIcelanderIndian (Asian)IndonesianInupiatIranianIraqiIrishIroquoisIsraeliItalianJamaicanJapaneseJordanianKenyanKiowaKoreanLaotianLatvianLebaneseLiberianLithuanianLumbeeLuxembourgerMacedonianMalaysianMalteseMarshalleseMenomineeMexicanMexican American IndianMongolianMoroccanNative HawaiianNavajoNepaleseNew ZealanderNicaraguanNigerianNorthern EuropeanNorwegianOkinawanOsageOttawaPaiutePakistaniPalestinianPanamanianParaguayanPennsylvania GermanPeruvianPimaPolishPortuguesePotawatomiPuebloPuerto RicanPuget Sound SalishRomanianRussianSalvadoranSamoanScandinavianScotch-IrishScottishSeminoleSenegaleseSerbianShoshoneSierra LeoneanSiouxSlavicSlovakSloveneSomaliSouth AfricanSouth AmericanSouth American IndianSoviet UnionSpaniardSpanishSpanish AmericanSpanish American IndianSri LankanSubsaharan AfricanSudaneseSwedishSwissSyrianTaiwaneseThaiTlingit-HaidaTohono O'OdhamTonganTrinidadian and TobagonianTsimshianTurkishU.S. Virgin IslanderUgandanUkrainianUruguayanUteVenezuelanVietnameseWelshWest IndianYakamaYaquiYugoslavianYumanYup'ikZimbabwean
Immigration
NonimmigrantsImmigrantsAfghanistanAfricaAlbaniaArgentinaArmeniaAsiaAustraliaAustriaBahamasBangladeshBarbadosBelarusBelgiumBelizeBoliviaBosnia and HerzegovinaBrazilBulgariaBurma/MyanmarCabo VerdeCambodiaCameroonCanadaCaribbeanCentral AmericaChileChinaColombiaCongoCosta RicaCroatiaCubaCzechoslovakiaDenmarkDominicaDominican RepublicEastern AfricaEastern AsiaEastern EuropeEcuadorEgyptEl SalvadorEnglandEritreaEthiopiaEuropeFijiFranceGermanyGhanaGreeceGrenadaGuatemalaGuyanaHaitiHondurasHong KongHungaryIndiaIndonesiaIranIraqIrelandIsraelItalyJamaicaJapanJordanKazakhstanKenyaKoreaKuwaitLaosLatin AmericaLatviaLebanonLiberiaLithuaniaMalaysiaMexicoMicronesiaMiddle AfricaMoldovaMoroccoNepalNetherlandsNicaraguaNigeriaNorth AmericaNorth MacedoniaNorthern AfricaNorthern EuropeNorwayOceaniaPakistanPanamaPeruPhilippinesPolandPortugalRomaniaRussiaSaudi ArabiaScotlandSenegalSerbiaSierra LeoneSingaporeSomaliaSouth AfricaSouth AmericaSouth Central AsiaSouth Eastern AsiaSouthern EuropeSpainSri LankaSt. Vincent and the GrenadinesSudanSwedenSwitzerlandSyriaTaiwanThailandTrinidad and TobagoTurkeyUgandaUkraineUruguayUzbekistanVenezuelaVietnamWest IndiesWestern AfricaWestern AsiaWestern EuropeYemenZaireZimbabweAzores
Select to Compare
Race
Ancestry
AfghanAfricanAlaska NativeAlaskan AthabascanAlbanianAleutAlsatianAmericanApacheArabArapahoArgentineanArmenianAssyrian/Chaldean/SyriacAustralianAustrianBahamianBangladeshiBarbadianBasqueBelgianBelizeanBermudanBhutaneseBlackfeetBolivianBrazilianBritishBritish West IndianBulgarianBurmeseCajunCambodianCanadianCape VerdeanCarpatho RusynCelticCentral AmericanCentral American IndianCherokeeCheyenneChickasawChileanChineseChippewaChoctawColombianColvilleComancheCosta RicanCreeCreekCroatianCrowCubanCypriotCzechCzechoslovakianDanishDelawareDominicanDutchDutch West IndianEastern EuropeanEcuadorianEgyptianEnglishEstonianEthiopianEuropeanFijianFilipinoFinnishFrenchFrench American IndianFrench CanadianGermanGerman RussianGhanaianGreekGuamanian/ChamorroGuatemalanGuyaneseHaitianHmongHonduranHopiHoumaHungarianIcelanderIndian (Asian)IndonesianInupiatIranianIraqiIrishIroquoisIsraeliItalianJamaicanJapaneseJordanianKenyanKiowaKoreanLaotianLatvianLebaneseLiberianLithuanianLumbeeLuxembourgerMacedonianMalaysianMalteseMarshalleseMenomineeMexicanMexican American IndianMongolianMoroccanNative HawaiianNavajoNepaleseNew ZealanderNicaraguanNigerianNorthern EuropeanNorwegianOkinawanOttawaPaiutePakistaniPalestinianPanamanianParaguayanPennsylvania GermanPeruvianPimaPolishPortuguesePotawatomiPuebloPuerto RicanPuget Sound SalishRomanianRussianSalvadoranSamoanScandinavianScotch-IrishScottishSeminoleSenegaleseSerbianShoshoneSierra LeoneanSiouxSlavicSlovakSloveneSomaliSouth AfricanSouth AmericanSouth American IndianSoviet UnionSpaniardSpanishSpanish AmericanSpanish American IndianSri LankanSubsaharan AfricanSudaneseSwedishSwissSyrianTaiwaneseThaiTlingit-HaidaTohono O'OdhamTonganTrinidadian and TobagonianTsimshianTurkishU.S. Virgin IslanderUgandanUkrainianUruguayanUteVenezuelanVietnameseWelshWest IndianYakamaYaquiYugoslavianYumanYup'ikZimbabwean
Immigration
NonimmigrantsImmigrantsAfghanistanAfricaAlbaniaArgentinaArmeniaAsiaAustraliaAustriaBahamasBangladeshBarbadosBelarusBelgiumBelizeBoliviaBosnia and HerzegovinaBrazilBulgariaBurma/MyanmarCabo VerdeCambodiaCameroonCanadaCaribbeanCentral AmericaChileChinaColombiaCongoCosta RicaCroatiaCubaCzechoslovakiaDenmarkDominicaDominican RepublicEastern AfricaEastern AsiaEastern EuropeEcuadorEgyptEl SalvadorEnglandEritreaEthiopiaEuropeFijiFranceGermanyGhanaGreeceGrenadaGuatemalaGuyanaHaitiHondurasHong KongHungaryIndiaIndonesiaIranIraqIrelandIsraelItalyJamaicaJapanJordanKazakhstanKenyaKoreaKuwaitLaosLatin AmericaLatviaLebanonLiberiaLithuaniaMalaysiaMexicoMicronesiaMiddle AfricaMoldovaMoroccoNepalNetherlandsNicaraguaNigeriaNorth AmericaNorth MacedoniaNorthern AfricaNorthern EuropeNorwayOceaniaPakistanPanamaPeruPhilippinesPolandPortugalRomaniaRussiaSaudi ArabiaScotlandSenegalSerbiaSierra LeoneSingaporeSomaliaSouth AfricaSouth AmericaSouth Central AsiaSouth Eastern AsiaSouthern EuropeSpainSri LankaSt. Vincent and the GrenadinesSudanSwedenSwitzerlandSyriaTaiwanThailandTrinidad and TobagoTurkeyUgandaUkraineUruguayUzbekistanVenezuelaVietnamWest IndiesWestern AfricaWestern AsiaWestern EuropeYemenZaireZimbabweAzores
Wage/Income Gap
Income
Poverty
Unemployment
Labor Participation
Family Structure
Vehicle Availability
Education Level
Disability

Osage Wage/Income Gap
Tragic

27.1%
WAGE/INCOME GAP
4.4/ 100
METRIC RATING
238th/ 347
METRIC RANK

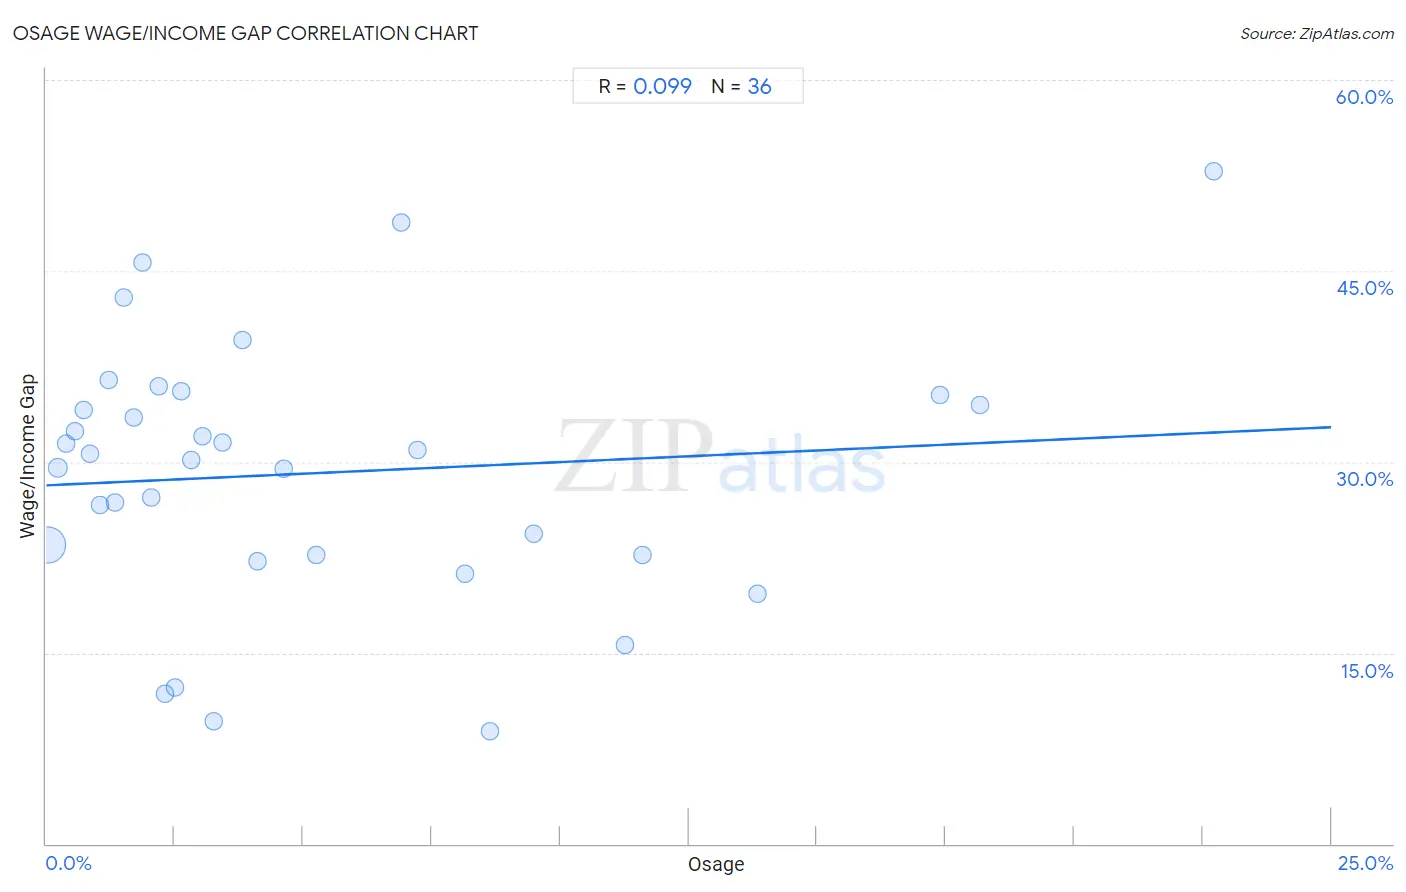
Osage Wage/Income Gap Correlation Chart

The statistical analysis conducted on geographies consisting of 91,772,804 people shows a slight positive correlation between the proportion of Osage and wage/income gap percentage in the United States with a correlation coefficient (R) of 0.099 and weighted average of 27.1%. On average, for every 1% (one percent) increase in Osage within a typical geography, there is an increase of 0.18% in wage/income gap percentage.
Osage Wage/Income Gap
It is essential to understand that the correlation between the percentage of Osage and wage/income gap percentage does not imply a direct cause-and-effect relationship. It remains uncertain whether the presence of Osage influences an upward or downward trend in the level of wage/income gap percentage within an area, or if Osage simply ended up residing in those areas with higher or lower levels of wage/income gap percentage due to other factors.

Demographics Similar to Osage by Wage/Income Gap

In terms of wage/income gap, the demographic groups most similar to Osage are Immigrants from Eastern Asia (27.1%, a difference of 0.0%), Estonian (27.1%, a difference of 0.020%), Immigrants from Romania (27.0%, a difference of 0.15%), Immigrants from Hungary (27.0%, a difference of 0.16%), and Immigrants from Pakistan (27.0%, a difference of 0.18%).
DemographicsRating | RankWage/Income Gap
Bhutanese
5.3
/100
|
#231
Tragic
27.0%
Argentineans
5.2
/100
|
#232
Tragic
27.0%
Immigrants from Brazil
5.0
/100
|
#233
Tragic
27.0%
Immigrants from Pakistan
4.9
/100
|
#234
Tragic
27.0%
Immigrants from Hungary
4.8
/100
|
#235
Tragic
27.0%
Immigrants from Romania
4.8
/100
|
#236
Tragic
27.0%
Immigrants from Eastern Asia
4.4
/100
|
#237
Tragic
27.1%
Osage
4.4
/100
|
#238
Tragic
27.1%
Estonians
4.3
/100
|
#239
Tragic
27.1%
Immigrants from Europe
3.8
/100
|
#240
Tragic
27.1%
Creek
3.8
/100
|
#241
Tragic
27.1%
Immigrants from Sri Lanka
3.7
/100
|
#242
Tragic
27.1%
Spanish
3.6
/100
|
#243
Tragic
27.1%
Chickasaw
3.5
/100
|
#244
Tragic
27.2%
Immigrants from the Azores
3.5
/100
|
#245
Tragic
27.2%

Osage Wage/Income Gap Correlation Summary

MeasurementOsage DataWage/Income Gap Data
Minimum0.021%8.8%
Maximum22.7%52.9%
Range22.7%44.1%
Mean5.2%29.1%
Median2.9%30.4%
Interquartile 25% (IQ1)1.4%22.6%
Interquartile 75% (IQ3)7.7%34.9%
Interquartile Range (IQR)6.3%12.2%
Standard Deviation (Sample)5.6%10.3%
Standard Deviation (Population)5.5%10.2%

Correlation Details

Osage PercentileSample SizeWage/Income Gap
[
0.0%
-
0.5%
]
0.021%
86,861,73823.5%
[
0.0%
-
0.5%
]
0.23%
3,078,37929.5%
[
0.0%
-
0.5%
]
0.39%
825,57031.4%
[
0.5%
-
1.0%
]
0.55%
256,22532.4%
[
0.5%
-
1.0%
]
0.73%
170,24634.1%
[
0.5%
-
1.0%
]
0.86%
127,05430.7%
[
1.0%
-
1.5%
]
1.04%
157,41526.6%
[
1.0%
-
1.5%
]
1.21%
55,91236.4%
[
1.0%
-
1.5%
]
1.34%
42,75726.8%
[
1.5%
-
2.0%
]
1.51%
26,48743.0%
[
1.5%
-
2.0%
]
1.71%
65,65433.5%
[
1.5%
-
2.0%
]
1.88%
5,05345.6%
[
2.0%
-
2.5%
]
2.04%
21,90927.2%
[
2.0%
-
2.5%
]
2.18%
8,61236.0%
[
2.0%
-
2.5%
]
2.30%
2,08311.8%
[
2.0%
-
2.5%
]
2.50%
24012.2%
[
2.5%
-
3.0%
]
2.63%
4,75835.5%
[
2.5%
-
3.0%
]
2.83%
1,09530.1%
[
3.0%
-
3.5%
]
3.03%
6,17132.0%
[
3.0%
-
3.5%
]
3.26%
1,2899.6%
[
3.0%
-
3.5%
]
3.42%
14,99031.5%
[
3.5%
-
4.0%
]
3.82%
68039.6%
[
4.0%
-
4.5%
]
4.10%
6,68422.2%
[
4.5%
-
5.0%
]
4.62%
71529.5%
[
5.0%
-
5.5%
]
5.26%
8,46322.7%
[
6.5%
-
7.0%
]
6.90%
8748.8%
[
7.0%
-
7.5%
]
7.23%
31830.9%
[
8.0%
-
8.5%
]
8.15%
3,32721.2%
[
8.5%
-
9.0%
]
8.62%
4,1408.8%
[
9.0%
-
9.5%
]
9.48%
1,92024.4%
[
11.0%
-
11.5%
]
11.27%
3,00915.7%
[
11.5%
-
12.0%
]
11.60%
4,90522.6%
[
13.5%
-
14.0%
]
13.84%
1,66219.6%
[
17.0%
-
17.5%
]
17.40%
1,59235.3%
[
18.0%
-
18.5%
]
18.17%
1,17234.5%
[
22.5%
-
23.0%
]
22.72%
49352.9%