Osage 4 or more Vehicles in Household
COMPARE
Osage
Select to Compare
4 or more Vehicles in Household
Osage 4 or more Vehicles in Household
7.8%
4+ VEHICLES AVAILABLE
100.0/ 100
METRIC RATING
47th/ 347
METRIC RANK
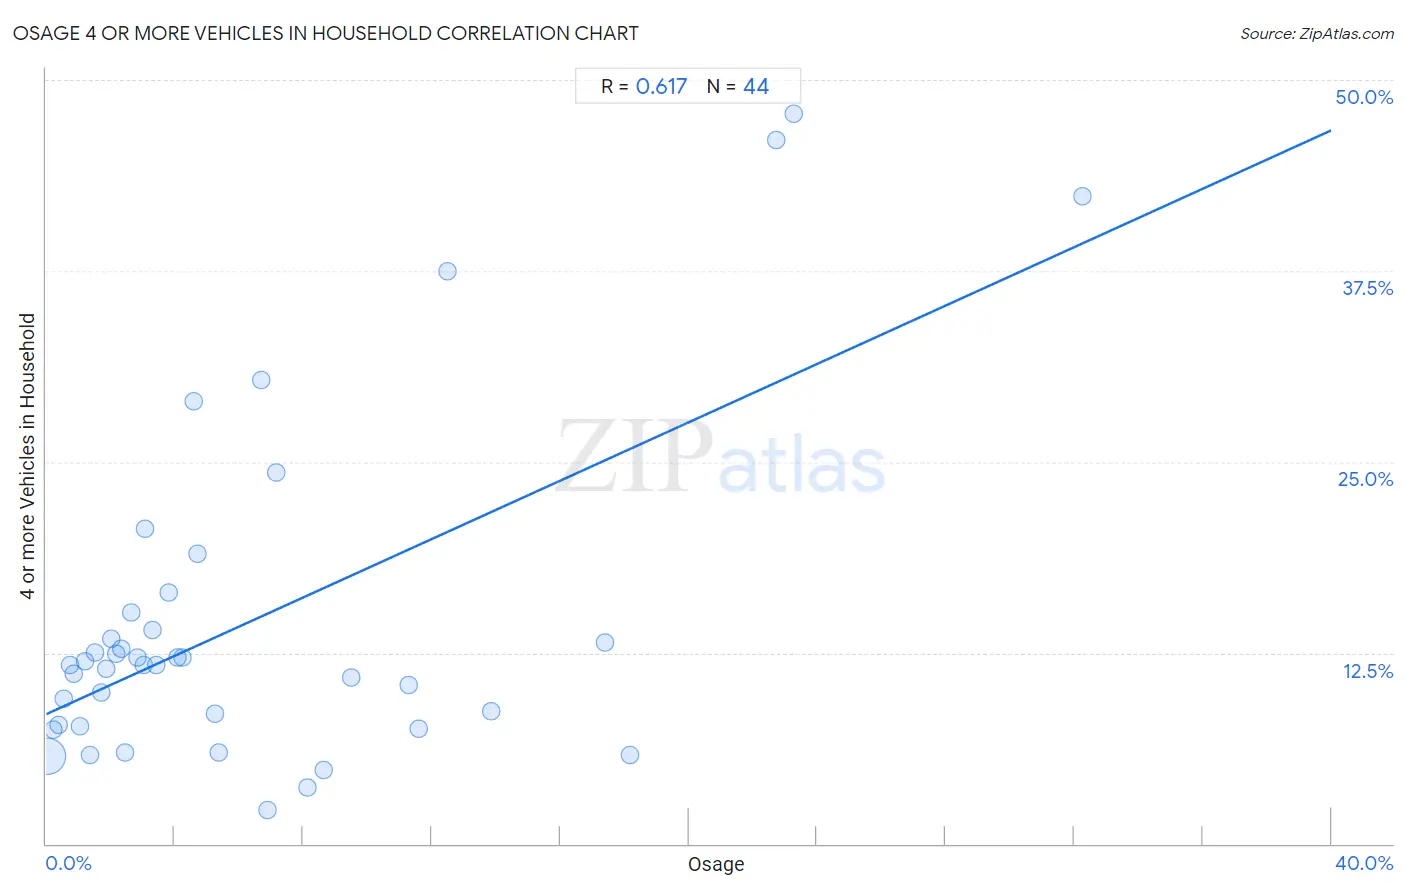
Osage 4 or more Vehicles in Household Correlation Chart
The statistical analysis conducted on geographies consisting of 91,747,496 people shows a significant positive correlation between the proportion of Osage and percentage of households with 4 or more vehicles available in the United States with a correlation coefficient (R) of 0.617 and weighted average of 7.8%. On average, for every 1% (one percent) increase in Osage within a typical geography, there is an increase of 0.96% in percentage of households with 4 or more vehicles available.
It is essential to understand that the correlation between the percentage of Osage and percentage of households with 4 or more vehicles available does not imply a direct cause-and-effect relationship. It remains uncertain whether the presence of Osage influences an upward or downward trend in the level of percentage of households with 4 or more vehicles available within an area, or if Osage simply ended up residing in those areas with higher or lower levels of percentage of households with 4 or more vehicles available due to other factors.
Demographics Similar to Osage by 4 or more Vehicles in Household
In terms of 4 or more vehicles in household, the demographic groups most similar to Osage are Crow (7.8%, a difference of 0.16%), Swiss (7.8%, a difference of 0.17%), Choctaw (7.8%, a difference of 0.33%), Cherokee (7.7%, a difference of 0.36%), and Bhutanese (7.8%, a difference of 0.38%).
| Demographics | Rating | Rank | 4 or more Vehicles in Household |
| Spanish | 100.0 /100 | #40 | Exceptional 7.9% |
| Pima | 100.0 /100 | #41 | Exceptional 7.9% |
| Salvadorans | 100.0 /100 | #42 | Exceptional 7.8% |
| Fijians | 100.0 /100 | #43 | Exceptional 7.8% |
| Bhutanese | 100.0 /100 | #44 | Exceptional 7.8% |
| Choctaw | 100.0 /100 | #45 | Exceptional 7.8% |
| Crow | 100.0 /100 | #46 | Exceptional 7.8% |
| Osage | 100.0 /100 | #47 | Exceptional 7.8% |
| Swiss | 100.0 /100 | #48 | Exceptional 7.8% |
| Cherokee | 100.0 /100 | #49 | Exceptional 7.7% |
| Immigrants from El Salvador | 100.0 /100 | #50 | Exceptional 7.7% |
| Immigrants from Laos | 100.0 /100 | #51 | Exceptional 7.7% |
| Japanese | 100.0 /100 | #52 | Exceptional 7.7% |
| Malaysians | 100.0 /100 | #53 | Exceptional 7.7% |
| Dutch | 100.0 /100 | #54 | Exceptional 7.7% |
Osage 4 or more Vehicles in Household Correlation Summary
| Measurement | Osage Data | 4 or more Vehicles in Household Data |
| Minimum | 0.021% | 2.2% |
| Maximum | 32.3% | 47.8% |
| Range | 32.2% | 45.7% |
| Mean | 6.4% | 14.6% |
| Median | 3.6% | 11.7% |
| Interquartile 25% (IQ1) | 1.8% | 7.7% |
| Interquartile 75% (IQ3) | 8.4% | 14.6% |
| Interquartile Range (IQR) | 6.6% | 6.8% |
| Standard Deviation (Sample) | 7.1% | 11.0% |
| Standard Deviation (Population) | 7.0% | 10.9% |
Correlation Details
| Osage Percentile | Sample Size | 4 or more Vehicles in Household |
[ 0.0% - 0.5% ] 0.021% | 86,821,100 | 5.8% |
[ 0.0% - 0.5% ] 0.23% | 3,078,557 | 7.5% |
[ 0.0% - 0.5% ] 0.39% | 826,430 | 7.7% |
[ 0.5% - 1.0% ] 0.55% | 253,134 | 9.5% |
[ 0.5% - 1.0% ] 0.73% | 173,102 | 11.7% |
[ 0.5% - 1.0% ] 0.86% | 127,054 | 11.1% |
[ 1.0% - 1.5% ] 1.04% | 159,619 | 7.7% |
[ 1.0% - 1.5% ] 1.21% | 55,912 | 12.0% |
[ 1.0% - 1.5% ] 1.34% | 43,058 | 5.8% |
[ 1.5% - 2.0% ] 1.51% | 26,102 | 12.5% |
[ 1.5% - 2.0% ] 1.71% | 65,772 | 9.9% |
[ 1.5% - 2.0% ] 1.87% | 5,815 | 11.4% |
[ 2.0% - 2.5% ] 2.04% | 21,909 | 13.4% |
[ 2.0% - 2.5% ] 2.18% | 8,612 | 12.5% |
[ 2.0% - 2.5% ] 2.32% | 4,011 | 12.7% |
[ 2.0% - 2.5% ] 2.46% | 1,384 | 6.0% |
[ 2.5% - 3.0% ] 2.63% | 4,758 | 15.1% |
[ 2.5% - 3.0% ] 2.83% | 1,095 | 12.2% |
[ 3.0% - 3.5% ] 3.03% | 6,727 | 11.7% |
[ 3.0% - 3.5% ] 3.08% | 389 | 20.6% |
[ 3.0% - 3.5% ] 3.30% | 3,027 | 14.0% |
[ 3.0% - 3.5% ] 3.42% | 14,990 | 11.7% |
[ 3.5% - 4.0% ] 3.82% | 680 | 16.4% |
[ 4.0% - 4.5% ] 4.10% | 6,733 | 12.2% |
[ 4.0% - 4.5% ] 4.25% | 424 | 12.2% |
[ 4.5% - 5.0% ] 4.59% | 501 | 29.0% |
[ 4.5% - 5.0% ] 4.72% | 106 | 19.0% |
[ 5.0% - 5.5% ] 5.26% | 11,832 | 8.5% |
[ 5.0% - 5.5% ] 5.38% | 93 | 6.0% |
[ 6.5% - 7.0% ] 6.70% | 895 | 30.4% |
[ 6.5% - 7.0% ] 6.90% | 87 | 2.2% |
[ 7.0% - 7.5% ] 7.17% | 1,130 | 24.3% |
[ 8.0% - 8.5% ] 8.15% | 3,327 | 3.7% |
[ 8.5% - 9.0% ] 8.62% | 4,140 | 4.8% |
[ 9.0% - 9.5% ] 9.48% | 1,920 | 10.9% |
[ 11.0% - 11.5% ] 11.27% | 3,009 | 10.4% |
[ 11.5% - 12.0% ] 11.60% | 4,905 | 7.5% |
[ 12.0% - 12.5% ] 12.50% | 16 | 37.5% |
[ 13.5% - 14.0% ] 13.84% | 1,662 | 8.7% |
[ 17.0% - 17.5% ] 17.40% | 1,592 | 13.2% |
[ 18.0% - 18.5% ] 18.17% | 1,172 | 5.8% |
[ 22.5% - 23.0% ] 22.72% | 493 | 46.1% |
[ 23.0% - 23.5% ] 23.26% | 129 | 47.8% |
[ 32.0% - 32.5% ] 32.26% | 93 | 42.4% |