Osage Self-Care Disability
COMPARE
Osage
Select to Compare
Self-Care Disability
Osage Self-Care Disability
2.6%
SELF-CARE DISABILITY
3.6/ 100
METRIC RATING
224th/ 347
METRIC RANK
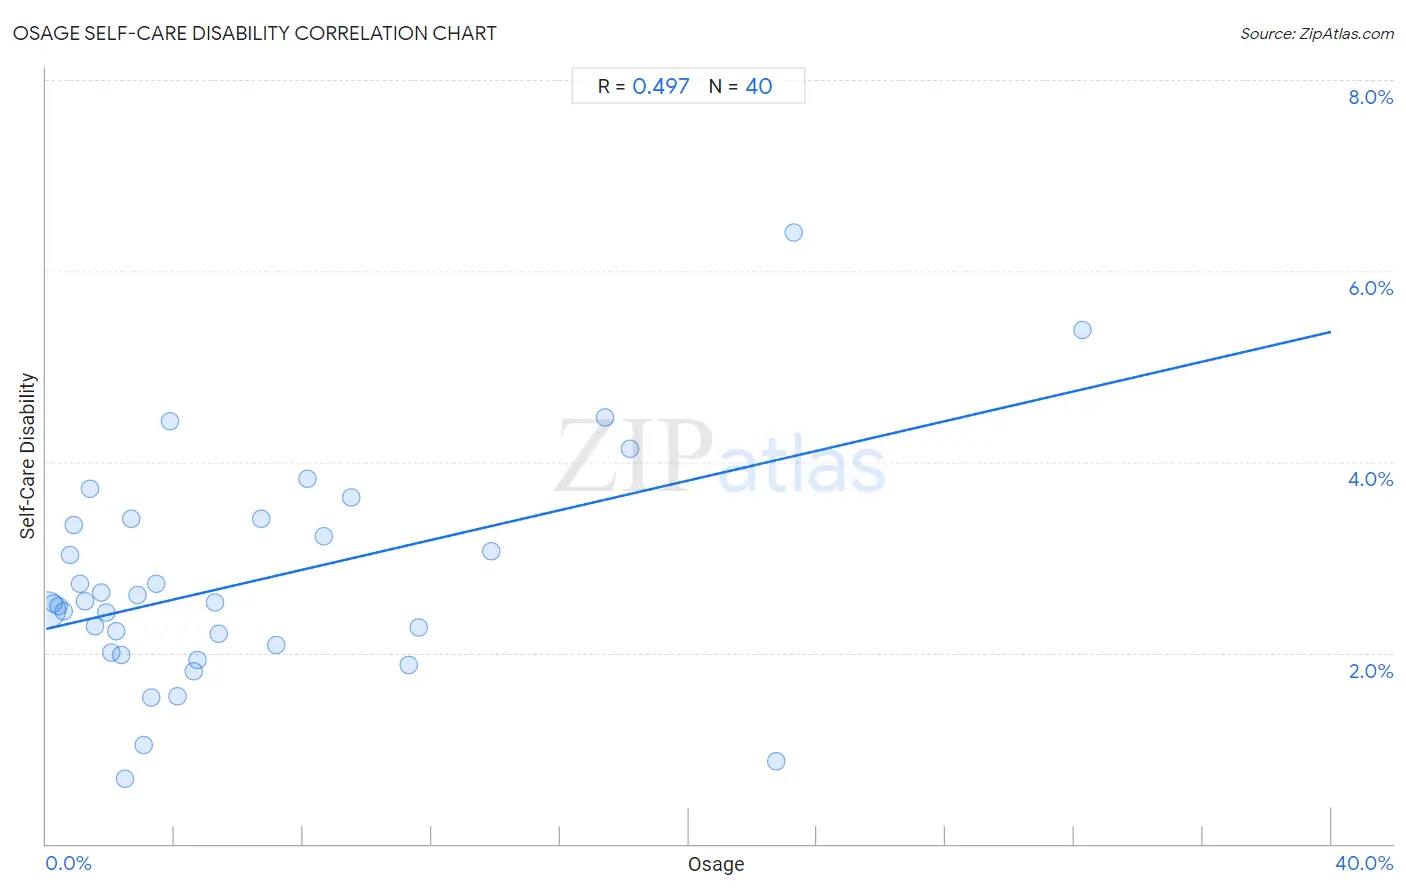
Osage Self-Care Disability Correlation Chart
The statistical analysis conducted on geographies consisting of 91,779,212 people shows a moderate positive correlation between the proportion of Osage and percentage of population with self-care disability in the United States with a correlation coefficient (R) of 0.497 and weighted average of 2.6%. On average, for every 1% (one percent) increase in Osage within a typical geography, there is an increase of 0.078% in percentage of population with self-care disability.
It is essential to understand that the correlation between the percentage of Osage and percentage of population with self-care disability does not imply a direct cause-and-effect relationship. It remains uncertain whether the presence of Osage influences an upward or downward trend in the level of percentage of population with self-care disability within an area, or if Osage simply ended up residing in those areas with higher or lower levels of percentage of population with self-care disability due to other factors.
Demographics Similar to Osage by Self-Care Disability
In terms of self-care disability, the demographic groups most similar to Osage are French Canadian (2.6%, a difference of 0.050%), Spaniard (2.6%, a difference of 0.060%), Honduran (2.6%, a difference of 0.070%), Subsaharan African (2.6%, a difference of 0.11%), and Immigrants from Moldova (2.6%, a difference of 0.12%).
| Demographics | Rating | Rank | Self-Care Disability |
| Celtics | 4.4 /100 | #217 | Tragic 2.6% |
| Scotch-Irish | 4.1 /100 | #218 | Tragic 2.6% |
| Immigrants from Moldova | 4.0 /100 | #219 | Tragic 2.6% |
| Sub-Saharan Africans | 4.0 /100 | #220 | Tragic 2.6% |
| Hondurans | 3.8 /100 | #221 | Tragic 2.6% |
| Spaniards | 3.8 /100 | #222 | Tragic 2.6% |
| French Canadians | 3.8 /100 | #223 | Tragic 2.6% |
| Osage | 3.6 /100 | #224 | Tragic 2.6% |
| Iraqis | 3.2 /100 | #225 | Tragic 2.6% |
| Chinese | 2.9 /100 | #226 | Tragic 2.6% |
| Immigrants from Philippines | 2.7 /100 | #227 | Tragic 2.6% |
| Guatemalans | 2.7 /100 | #228 | Tragic 2.6% |
| Guamanians/Chamorros | 2.5 /100 | #229 | Tragic 2.6% |
| Immigrants from Ecuador | 2.5 /100 | #230 | Tragic 2.6% |
| Immigrants from Guatemala | 2.2 /100 | #231 | Tragic 2.6% |
Osage Self-Care Disability Correlation Summary
| Measurement | Osage Data | Self-Care Disability Data |
| Minimum | 0.021% | 0.68% |
| Maximum | 32.3% | 6.4% |
| Range | 32.2% | 5.7% |
| Mean | 6.4% | 2.7% |
| Median | 3.3% | 2.5% |
| Interquartile 25% (IQ1) | 1.6% | 2.0% |
| Interquartile 75% (IQ3) | 8.4% | 3.4% |
| Interquartile Range (IQR) | 6.8% | 1.3% |
| Standard Deviation (Sample) | 7.4% | 1.2% |
| Standard Deviation (Population) | 7.3% | 1.1% |
Correlation Details
| Osage Percentile | Sample Size | Self-Care Disability |
[ 0.0% - 0.5% ] 0.021% | 86,853,734 | 2.4% |
[ 0.0% - 0.5% ] 0.23% | 3,079,340 | 2.5% |
[ 0.0% - 0.5% ] 0.39% | 826,191 | 2.5% |
[ 0.5% - 1.0% ] 0.55% | 253,134 | 2.4% |
[ 0.5% - 1.0% ] 0.73% | 173,932 | 3.0% |
[ 0.5% - 1.0% ] 0.86% | 127,054 | 3.3% |
[ 1.0% - 1.5% ] 1.04% | 159,619 | 2.7% |
[ 1.0% - 1.5% ] 1.21% | 55,912 | 2.5% |
[ 1.0% - 1.5% ] 1.34% | 43,058 | 3.7% |
[ 1.5% - 2.0% ] 1.51% | 26,487 | 2.3% |
[ 1.5% - 2.0% ] 1.71% | 65,714 | 2.6% |
[ 1.5% - 2.0% ] 1.87% | 5,815 | 2.4% |
[ 2.0% - 2.5% ] 2.04% | 21,909 | 2.0% |
[ 2.0% - 2.5% ] 2.18% | 8,659 | 2.2% |
[ 2.0% - 2.5% ] 2.32% | 4,011 | 2.0% |
[ 2.0% - 2.5% ] 2.46% | 1,384 | 0.68% |
[ 2.5% - 3.0% ] 2.63% | 4,758 | 3.4% |
[ 2.5% - 3.0% ] 2.83% | 1,095 | 2.6% |
[ 3.0% - 3.5% ] 3.03% | 6,171 | 1.0% |
[ 3.0% - 3.5% ] 3.26% | 1,289 | 1.5% |
[ 3.0% - 3.5% ] 3.42% | 14,990 | 2.7% |
[ 3.5% - 4.0% ] 3.84% | 1,486 | 4.4% |
[ 4.0% - 4.5% ] 4.10% | 6,733 | 1.6% |
[ 4.5% - 5.0% ] 4.60% | 239 | 1.8% |
[ 4.5% - 5.0% ] 4.72% | 106 | 1.9% |
[ 5.0% - 5.5% ] 5.26% | 11,832 | 2.5% |
[ 5.0% - 5.5% ] 5.38% | 93 | 2.2% |
[ 6.5% - 7.0% ] 6.70% | 895 | 3.4% |
[ 7.0% - 7.5% ] 7.17% | 1,130 | 2.1% |
[ 8.0% - 8.5% ] 8.15% | 3,327 | 3.8% |
[ 8.5% - 9.0% ] 8.62% | 4,140 | 3.2% |
[ 9.0% - 9.5% ] 9.48% | 1,920 | 3.6% |
[ 11.0% - 11.5% ] 11.27% | 3,009 | 1.9% |
[ 11.5% - 12.0% ] 11.60% | 4,905 | 2.3% |
[ 13.5% - 14.0% ] 13.84% | 1,662 | 3.1% |
[ 17.0% - 17.5% ] 17.40% | 1,592 | 4.5% |
[ 18.0% - 18.5% ] 18.17% | 1,172 | 4.1% |
[ 22.5% - 23.0% ] 22.72% | 493 | 0.86% |
[ 23.0% - 23.5% ] 23.26% | 129 | 6.4% |
[ 32.0% - 32.5% ] 32.26% | 93 | 5.4% |