Osage 3 or more Vehicles in Household

COMPARE

Osage
Race
Ancestry
AfghanAfricanAlaska NativeAlaskan AthabascanAlbanianAleutAlsatianAmericanApacheArabArapahoArgentineanArmenianAssyrian/Chaldean/SyriacAustralianAustrianBahamianBangladeshiBarbadianBasqueBelgianBelizeanBermudanBhutaneseBlackfeetBolivianBrazilianBritishBritish West IndianBulgarianBurmeseCajunCambodianCanadianCape VerdeanCarpatho RusynCelticCentral AmericanCentral American IndianCherokeeCheyenneChickasawChileanChineseChippewaChoctawColombianColvilleComancheCosta RicanCreeCreekCroatianCrowCubanCypriotCzechCzechoslovakianDanishDelawareDominicanDutchDutch West IndianEastern EuropeanEcuadorianEgyptianEnglishEstonianEthiopianEuropeanFijianFilipinoFinnishFrenchFrench American IndianFrench CanadianGermanGerman RussianGhanaianGreekGuamanian/ChamorroGuatemalanGuyaneseHaitianHmongHonduranHopiHoumaHungarianIcelanderIndian (Asian)IndonesianInupiatIranianIraqiIrishIroquoisIsraeliItalianJamaicanJapaneseJordanianKenyanKiowaKoreanLaotianLatvianLebaneseLiberianLithuanianLumbeeLuxembourgerMacedonianMalaysianMalteseMarshalleseMenomineeMexicanMexican American IndianMongolianMoroccanNative HawaiianNavajoNepaleseNew ZealanderNicaraguanNigerianNorthern EuropeanNorwegianOkinawanOsageOttawaPaiutePakistaniPalestinianPanamanianParaguayanPennsylvania GermanPeruvianPimaPolishPortuguesePotawatomiPuebloPuerto RicanPuget Sound SalishRomanianRussianSalvadoranSamoanScandinavianScotch-IrishScottishSeminoleSenegaleseSerbianShoshoneSierra LeoneanSiouxSlavicSlovakSloveneSomaliSouth AfricanSouth AmericanSouth American IndianSoviet UnionSpaniardSpanishSpanish AmericanSpanish American IndianSri LankanSubsaharan AfricanSudaneseSwedishSwissSyrianTaiwaneseThaiTlingit-HaidaTohono O'OdhamTonganTrinidadian and TobagonianTsimshianTurkishU.S. Virgin IslanderUgandanUkrainianUruguayanUteVenezuelanVietnameseWelshWest IndianYakamaYaquiYugoslavianYumanYup'ikZimbabwean
Immigration
NonimmigrantsImmigrantsAfghanistanAfricaAlbaniaArgentinaArmeniaAsiaAustraliaAustriaBahamasBangladeshBarbadosBelarusBelgiumBelizeBoliviaBosnia and HerzegovinaBrazilBulgariaBurma/MyanmarCabo VerdeCambodiaCameroonCanadaCaribbeanCentral AmericaChileChinaColombiaCongoCosta RicaCroatiaCubaCzechoslovakiaDenmarkDominicaDominican RepublicEastern AfricaEastern AsiaEastern EuropeEcuadorEgyptEl SalvadorEnglandEritreaEthiopiaEuropeFijiFranceGermanyGhanaGreeceGrenadaGuatemalaGuyanaHaitiHondurasHong KongHungaryIndiaIndonesiaIranIraqIrelandIsraelItalyJamaicaJapanJordanKazakhstanKenyaKoreaKuwaitLaosLatin AmericaLatviaLebanonLiberiaLithuaniaMalaysiaMexicoMicronesiaMiddle AfricaMoldovaMoroccoNepalNetherlandsNicaraguaNigeriaNorth AmericaNorth MacedoniaNorthern AfricaNorthern EuropeNorwayOceaniaPakistanPanamaPeruPhilippinesPolandPortugalRomaniaRussiaSaudi ArabiaScotlandSenegalSerbiaSierra LeoneSingaporeSomaliaSouth AfricaSouth AmericaSouth Central AsiaSouth Eastern AsiaSouthern EuropeSpainSri LankaSt. Vincent and the GrenadinesSudanSwedenSwitzerlandSyriaTaiwanThailandTrinidad and TobagoTurkeyUgandaUkraineUruguayUzbekistanVenezuelaVietnamWest IndiesWestern AfricaWestern AsiaWestern EuropeYemenZaireZimbabweAzores
Select to Compare
Race
Ancestry
AfghanAfricanAlaska NativeAlaskan AthabascanAlbanianAleutAlsatianAmericanApacheArabArapahoArgentineanArmenianAssyrian/Chaldean/SyriacAustralianAustrianBahamianBangladeshiBarbadianBasqueBelgianBelizeanBermudanBhutaneseBlackfeetBolivianBrazilianBritishBritish West IndianBulgarianBurmeseCajunCambodianCanadianCape VerdeanCarpatho RusynCelticCentral AmericanCentral American IndianCherokeeCheyenneChickasawChileanChineseChippewaChoctawColombianColvilleComancheCosta RicanCreeCreekCroatianCrowCubanCypriotCzechCzechoslovakianDanishDelawareDominicanDutchDutch West IndianEastern EuropeanEcuadorianEgyptianEnglishEstonianEthiopianEuropeanFijianFilipinoFinnishFrenchFrench American IndianFrench CanadianGermanGerman RussianGhanaianGreekGuamanian/ChamorroGuatemalanGuyaneseHaitianHmongHonduranHopiHoumaHungarianIcelanderIndian (Asian)IndonesianInupiatIranianIraqiIrishIroquoisIsraeliItalianJamaicanJapaneseJordanianKenyanKiowaKoreanLaotianLatvianLebaneseLiberianLithuanianLumbeeLuxembourgerMacedonianMalaysianMalteseMarshalleseMenomineeMexicanMexican American IndianMongolianMoroccanNative HawaiianNavajoNepaleseNew ZealanderNicaraguanNigerianNorthern EuropeanNorwegianOkinawanOttawaPaiutePakistaniPalestinianPanamanianParaguayanPennsylvania GermanPeruvianPimaPolishPortuguesePotawatomiPuebloPuerto RicanPuget Sound SalishRomanianRussianSalvadoranSamoanScandinavianScotch-IrishScottishSeminoleSenegaleseSerbianShoshoneSierra LeoneanSiouxSlavicSlovakSloveneSomaliSouth AfricanSouth AmericanSouth American IndianSoviet UnionSpaniardSpanishSpanish AmericanSpanish American IndianSri LankanSubsaharan AfricanSudaneseSwedishSwissSyrianTaiwaneseThaiTlingit-HaidaTohono O'OdhamTonganTrinidadian and TobagonianTsimshianTurkishU.S. Virgin IslanderUgandanUkrainianUruguayanUteVenezuelanVietnameseWelshWest IndianYakamaYaquiYugoslavianYumanYup'ikZimbabwean
Immigration
NonimmigrantsImmigrantsAfghanistanAfricaAlbaniaArgentinaArmeniaAsiaAustraliaAustriaBahamasBangladeshBarbadosBelarusBelgiumBelizeBoliviaBosnia and HerzegovinaBrazilBulgariaBurma/MyanmarCabo VerdeCambodiaCameroonCanadaCaribbeanCentral AmericaChileChinaColombiaCongoCosta RicaCroatiaCubaCzechoslovakiaDenmarkDominicaDominican RepublicEastern AfricaEastern AsiaEastern EuropeEcuadorEgyptEl SalvadorEnglandEritreaEthiopiaEuropeFijiFranceGermanyGhanaGreeceGrenadaGuatemalaGuyanaHaitiHondurasHong KongHungaryIndiaIndonesiaIranIraqIrelandIsraelItalyJamaicaJapanJordanKazakhstanKenyaKoreaKuwaitLaosLatin AmericaLatviaLebanonLiberiaLithuaniaMalaysiaMexicoMicronesiaMiddle AfricaMoldovaMoroccoNepalNetherlandsNicaraguaNigeriaNorth AmericaNorth MacedoniaNorthern AfricaNorthern EuropeNorwayOceaniaPakistanPanamaPeruPhilippinesPolandPortugalRomaniaRussiaSaudi ArabiaScotlandSenegalSerbiaSierra LeoneSingaporeSomaliaSouth AfricaSouth AmericaSouth Central AsiaSouth Eastern AsiaSouthern EuropeSpainSri LankaSt. Vincent and the GrenadinesSudanSwedenSwitzerlandSyriaTaiwanThailandTrinidad and TobagoTurkeyUgandaUkraineUruguayUzbekistanVenezuelaVietnamWest IndiesWestern AfricaWestern AsiaWestern EuropeYemenZaireZimbabweAzores
3 or more Vehicles in Household
Income
Poverty
Unemployment
Labor Participation
Family Structure
Vehicle Availability
Education Level
Disability

Osage 3 or more Vehicles in Household
Exceptional

22.7%
3+ VEHICLES AVAILABLE
100.0/ 100
METRIC RATING
43rd/ 347
METRIC RANK

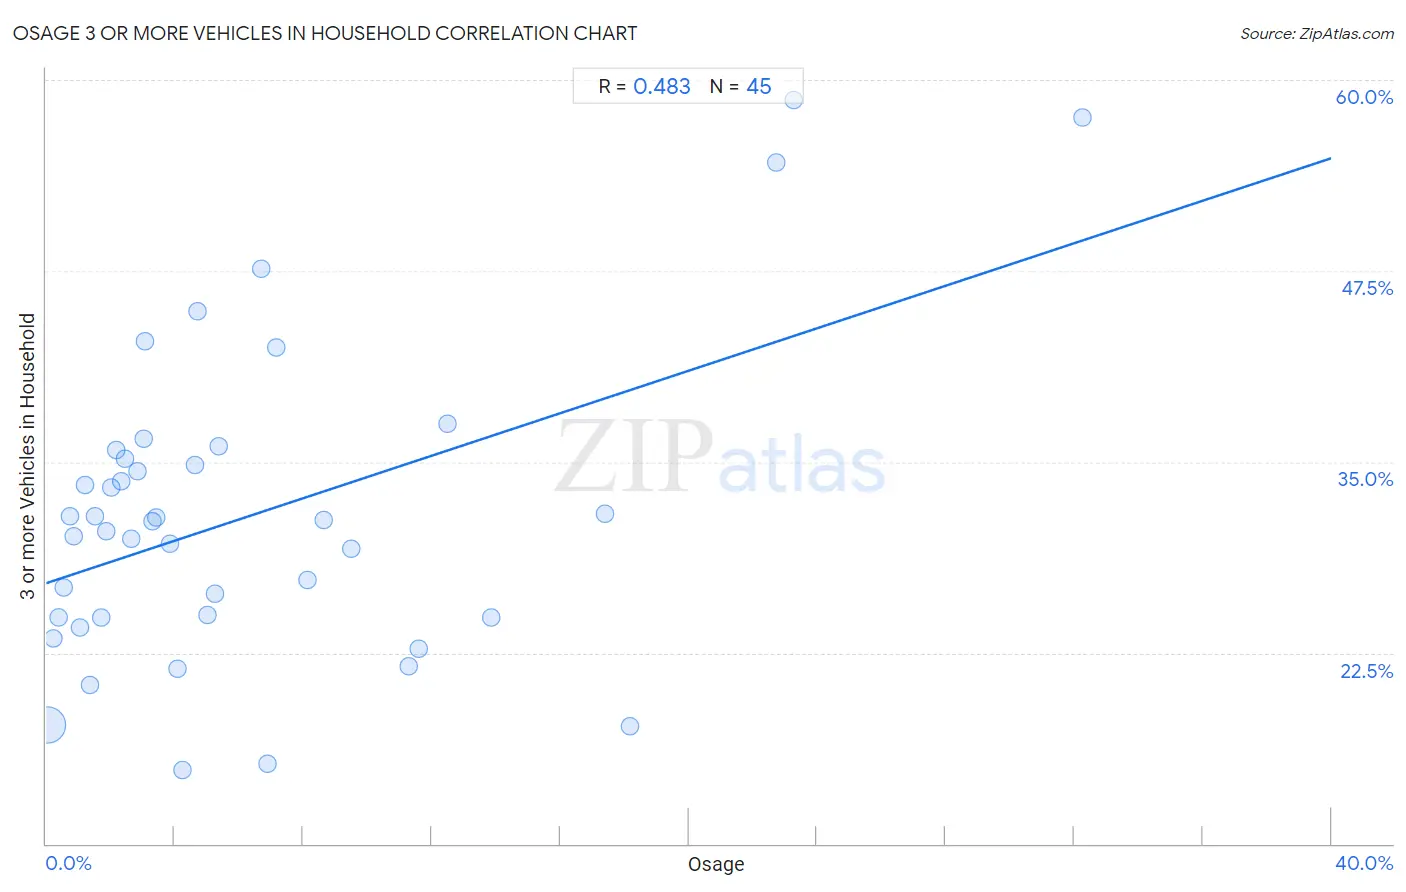
Osage 3 or more Vehicles in Household Correlation Chart

The statistical analysis conducted on geographies consisting of 91,796,142 people shows a moderate positive correlation between the proportion of Osage and percentage of households with 3 or more vehicles available in the United States with a correlation coefficient (R) of 0.483 and weighted average of 22.7%. On average, for every 1% (one percent) increase in Osage within a typical geography, there is an increase of 0.70% in percentage of households with 3 or more vehicles available.
Osage 3 or more Vehicles in Household
It is essential to understand that the correlation between the percentage of Osage and percentage of households with 3 or more vehicles available does not imply a direct cause-and-effect relationship. It remains uncertain whether the presence of Osage influences an upward or downward trend in the level of percentage of households with 3 or more vehicles available within an area, or if Osage simply ended up residing in those areas with higher or lower levels of percentage of households with 3 or more vehicles available due to other factors.

Demographics Similar to Osage by 3 or more Vehicles in Household

In terms of 3 or more vehicles in household, the demographic groups most similar to Osage are Native/Alaskan (22.7%, a difference of 0.11%), German (22.7%, a difference of 0.12%), Cheyenne (22.7%, a difference of 0.13%), Ute (22.7%, a difference of 0.23%), and American (22.6%, a difference of 0.42%).
DemographicsRating | Rank3 or more Vehicles in Household
Cherokee
100.0
/100
|
#36
Exceptional
23.0%
Swedes
100.0
/100
|
#37
Exceptional
23.0%
Dutch
100.0
/100
|
#38
Exceptional
22.9%
Yaqui
100.0
/100
|
#39
Exceptional
22.9%
Europeans
100.0
/100
|
#40
Exceptional
22.9%
Germans
100.0
/100
|
#41
Exceptional
22.7%
Natives/Alaskans
100.0
/100
|
#42
Exceptional
22.7%
Osage
100.0
/100
|
#43
Exceptional
22.7%
Cheyenne
100.0
/100
|
#44
Exceptional
22.7%
Ute
100.0
/100
|
#45
Exceptional
22.7%
Americans
100.0
/100
|
#46
Exceptional
22.6%
Malaysians
100.0
/100
|
#47
Exceptional
22.6%
Scottish
100.0
/100
|
#48
Exceptional
22.6%
Scotch-Irish
100.0
/100
|
#49
Exceptional
22.6%
Sioux
100.0
/100
|
#50
Exceptional
22.6%

Osage 3 or more Vehicles in Household Correlation Summary

MeasurementOsage Data3 or more Vehicles in Household Data
Minimum0.021%14.9%
Maximum32.3%58.7%
Range32.2%43.8%
Mean6.4%31.5%
Median3.8%31.1%
Interquartile 25% (IQ1)1.8%24.8%
Interquartile 75% (IQ3)8.4%35.5%
Interquartile Range (IQR)6.6%10.7%
Standard Deviation (Sample)7.0%10.1%
Standard Deviation (Population)6.9%10.0%

Correlation Details

Osage PercentileSample Size3 or more Vehicles in Household
[
0.0%
-
0.5%
]
0.021%
86,865,41717.8%
[
0.0%
-
0.5%
]
0.23%
3,079,34023.4%
[
0.0%
-
0.5%
]
0.39%
826,43024.8%
[
0.5%
-
1.0%
]
0.55%
255,18826.8%
[
0.5%
-
1.0%
]
0.73%
173,10231.5%
[
0.5%
-
1.0%
]
0.86%
127,05430.2%
[
1.0%
-
1.5%
]
1.04%
159,61924.1%
[
1.0%
-
1.5%
]
1.21%
55,91233.5%
[
1.0%
-
1.5%
]
1.34%
43,05820.4%
[
1.5%
-
2.0%
]
1.51%
26,48731.4%
[
1.5%
-
2.0%
]
1.71%
65,77224.8%
[
1.5%
-
2.0%
]
1.87%
5,81530.5%
[
2.0%
-
2.5%
]
2.04%
21,90933.3%
[
2.0%
-
2.5%
]
2.18%
8,65935.8%
[
2.0%
-
2.5%
]
2.32%
4,01133.7%
[
2.0%
-
2.5%
]
2.46%
1,38435.2%
[
2.5%
-
3.0%
]
2.63%
4,75830.0%
[
2.5%
-
3.0%
]
2.83%
1,09534.4%
[
3.0%
-
3.5%
]
3.03%
6,72736.5%
[
3.0%
-
3.5%
]
3.08%
38942.9%
[
3.0%
-
3.5%
]
3.30%
3,02731.1%
[
3.0%
-
3.5%
]
3.42%
14,99031.4%
[
3.5%
-
4.0%
]
3.84%
1,48629.7%
[
4.0%
-
4.5%
]
4.10%
6,73321.4%
[
4.0%
-
4.5%
]
4.25%
42414.9%
[
4.5%
-
5.0%
]
4.62%
71534.8%
[
4.5%
-
5.0%
]
4.72%
10644.8%
[
5.0%
-
5.5%
]
5.00%
4025.0%
[
5.0%
-
5.5%
]
5.26%
11,83226.4%
[
5.0%
-
5.5%
]
5.38%
9336.0%
[
6.5%
-
7.0%
]
6.70%
89547.6%
[
6.5%
-
7.0%
]
6.90%
8715.2%
[
7.0%
-
7.5%
]
7.17%
1,13042.5%
[
8.0%
-
8.5%
]
8.15%
3,32727.3%
[
8.5%
-
9.0%
]
8.62%
4,14031.2%
[
9.0%
-
9.5%
]
9.48%
1,92029.3%
[
11.0%
-
11.5%
]
11.27%
3,00921.6%
[
11.5%
-
12.0%
]
11.60%
4,90522.7%
[
12.0%
-
12.5%
]
12.50%
1637.5%
[
13.5%
-
14.0%
]
13.84%
1,66224.8%
[
17.0%
-
17.5%
]
17.40%
1,59231.6%
[
18.0%
-
18.5%
]
18.17%
1,17217.7%
[
22.5%
-
23.0%
]
22.72%
49354.6%
[
23.0%
-
23.5%
]
23.26%
12958.7%
[
32.0%
-
32.5%
]
32.26%
9357.6%