Osage Disability Age Under 5

COMPARE

Osage
Race
Ancestry
AfghanAfricanAlaska NativeAlaskan AthabascanAlbanianAleutAlsatianAmericanApacheArabArapahoArgentineanArmenianAssyrian/Chaldean/SyriacAustralianAustrianBahamianBangladeshiBarbadianBasqueBelgianBelizeanBermudanBhutaneseBlackfeetBolivianBrazilianBritishBritish West IndianBulgarianBurmeseCajunCambodianCanadianCape VerdeanCarpatho RusynCelticCentral AmericanCentral American IndianCherokeeCheyenneChickasawChileanChineseChippewaChoctawColombianColvilleComancheCosta RicanCreeCreekCroatianCrowCubanCypriotCzechCzechoslovakianDanishDelawareDominicanDutchDutch West IndianEastern EuropeanEcuadorianEgyptianEnglishEstonianEthiopianEuropeanFijianFilipinoFinnishFrenchFrench American IndianFrench CanadianGermanGerman RussianGhanaianGreekGuamanian/ChamorroGuatemalanGuyaneseHaitianHmongHonduranHopiHoumaHungarianIcelanderIndian (Asian)IndonesianInupiatIranianIraqiIrishIroquoisIsraeliItalianJamaicanJapaneseJordanianKenyanKiowaKoreanLaotianLatvianLebaneseLiberianLithuanianLumbeeLuxembourgerMacedonianMalaysianMalteseMarshalleseMenomineeMexicanMexican American IndianMongolianMoroccanNative HawaiianNavajoNepaleseNew ZealanderNicaraguanNigerianNorthern EuropeanNorwegianOkinawanOsageOttawaPaiutePakistaniPalestinianPanamanianParaguayanPennsylvania GermanPeruvianPimaPolishPortuguesePotawatomiPuebloPuerto RicanPuget Sound SalishRomanianRussianSalvadoranSamoanScandinavianScotch-IrishScottishSeminoleSenegaleseSerbianShoshoneSierra LeoneanSiouxSlavicSlovakSloveneSomaliSouth AfricanSouth AmericanSouth American IndianSoviet UnionSpaniardSpanishSpanish AmericanSpanish American IndianSri LankanSubsaharan AfricanSudaneseSwedishSwissSyrianTaiwaneseThaiTlingit-HaidaTohono O'OdhamTonganTrinidadian and TobagonianTsimshianTurkishU.S. Virgin IslanderUgandanUkrainianUruguayanUteVenezuelanVietnameseWelshWest IndianYakamaYaquiYugoslavianYumanYup'ikZimbabwean
Immigration
NonimmigrantsImmigrantsAfghanistanAfricaAlbaniaArgentinaArmeniaAsiaAustraliaAustriaBahamasBangladeshBarbadosBelarusBelgiumBelizeBoliviaBosnia and HerzegovinaBrazilBulgariaBurma/MyanmarCabo VerdeCambodiaCameroonCanadaCaribbeanCentral AmericaChileChinaColombiaCongoCosta RicaCroatiaCubaCzechoslovakiaDenmarkDominicaDominican RepublicEastern AfricaEastern AsiaEastern EuropeEcuadorEgyptEl SalvadorEnglandEritreaEthiopiaEuropeFijiFranceGermanyGhanaGreeceGrenadaGuatemalaGuyanaHaitiHondurasHong KongHungaryIndiaIndonesiaIranIraqIrelandIsraelItalyJamaicaJapanJordanKazakhstanKenyaKoreaKuwaitLaosLatin AmericaLatviaLebanonLiberiaLithuaniaMalaysiaMexicoMicronesiaMiddle AfricaMoldovaMoroccoNepalNetherlandsNicaraguaNigeriaNorth AmericaNorth MacedoniaNorthern AfricaNorthern EuropeNorwayOceaniaPakistanPanamaPeruPhilippinesPolandPortugalRomaniaRussiaSaudi ArabiaScotlandSenegalSerbiaSierra LeoneSingaporeSomaliaSouth AfricaSouth AmericaSouth Central AsiaSouth Eastern AsiaSouthern EuropeSpainSri LankaSt. Vincent and the GrenadinesSudanSwedenSwitzerlandSyriaTaiwanThailandTrinidad and TobagoTurkeyUgandaUkraineUruguayUzbekistanVenezuelaVietnamWest IndiesWestern AfricaWestern AsiaWestern EuropeYemenZaireZimbabweAzores
Select to Compare
Race
Ancestry
AfghanAfricanAlaska NativeAlaskan AthabascanAlbanianAleutAlsatianAmericanApacheArabArapahoArgentineanArmenianAssyrian/Chaldean/SyriacAustralianAustrianBahamianBangladeshiBarbadianBasqueBelgianBelizeanBermudanBhutaneseBlackfeetBolivianBrazilianBritishBritish West IndianBulgarianBurmeseCajunCambodianCanadianCape VerdeanCarpatho RusynCelticCentral AmericanCentral American IndianCherokeeCheyenneChickasawChileanChineseChippewaChoctawColombianColvilleComancheCosta RicanCreeCreekCroatianCrowCubanCypriotCzechCzechoslovakianDanishDelawareDominicanDutchDutch West IndianEastern EuropeanEcuadorianEgyptianEnglishEstonianEthiopianEuropeanFijianFilipinoFinnishFrenchFrench American IndianFrench CanadianGermanGerman RussianGhanaianGreekGuamanian/ChamorroGuatemalanGuyaneseHaitianHmongHonduranHopiHoumaHungarianIcelanderIndian (Asian)IndonesianInupiatIranianIraqiIrishIroquoisIsraeliItalianJamaicanJapaneseJordanianKenyanKiowaKoreanLaotianLatvianLebaneseLiberianLithuanianLumbeeLuxembourgerMacedonianMalaysianMalteseMarshalleseMenomineeMexicanMexican American IndianMongolianMoroccanNative HawaiianNavajoNepaleseNew ZealanderNicaraguanNigerianNorthern EuropeanNorwegianOkinawanOttawaPaiutePakistaniPalestinianPanamanianParaguayanPennsylvania GermanPeruvianPimaPolishPortuguesePotawatomiPuebloPuerto RicanPuget Sound SalishRomanianRussianSalvadoranSamoanScandinavianScotch-IrishScottishSeminoleSenegaleseSerbianShoshoneSierra LeoneanSiouxSlavicSlovakSloveneSomaliSouth AfricanSouth AmericanSouth American IndianSoviet UnionSpaniardSpanishSpanish AmericanSpanish American IndianSri LankanSubsaharan AfricanSudaneseSwedishSwissSyrianTaiwaneseThaiTlingit-HaidaTohono O'OdhamTonganTrinidadian and TobagonianTsimshianTurkishU.S. Virgin IslanderUgandanUkrainianUruguayanUteVenezuelanVietnameseWelshWest IndianYakamaYaquiYugoslavianYumanYup'ikZimbabwean
Immigration
NonimmigrantsImmigrantsAfghanistanAfricaAlbaniaArgentinaArmeniaAsiaAustraliaAustriaBahamasBangladeshBarbadosBelarusBelgiumBelizeBoliviaBosnia and HerzegovinaBrazilBulgariaBurma/MyanmarCabo VerdeCambodiaCameroonCanadaCaribbeanCentral AmericaChileChinaColombiaCongoCosta RicaCroatiaCubaCzechoslovakiaDenmarkDominicaDominican RepublicEastern AfricaEastern AsiaEastern EuropeEcuadorEgyptEl SalvadorEnglandEritreaEthiopiaEuropeFijiFranceGermanyGhanaGreeceGrenadaGuatemalaGuyanaHaitiHondurasHong KongHungaryIndiaIndonesiaIranIraqIrelandIsraelItalyJamaicaJapanJordanKazakhstanKenyaKoreaKuwaitLaosLatin AmericaLatviaLebanonLiberiaLithuaniaMalaysiaMexicoMicronesiaMiddle AfricaMoldovaMoroccoNepalNetherlandsNicaraguaNigeriaNorth AmericaNorth MacedoniaNorthern AfricaNorthern EuropeNorwayOceaniaPakistanPanamaPeruPhilippinesPolandPortugalRomaniaRussiaSaudi ArabiaScotlandSenegalSerbiaSierra LeoneSingaporeSomaliaSouth AfricaSouth AmericaSouth Central AsiaSouth Eastern AsiaSouthern EuropeSpainSri LankaSt. Vincent and the GrenadinesSudanSwedenSwitzerlandSyriaTaiwanThailandTrinidad and TobagoTurkeyUgandaUkraineUruguayUzbekistanVenezuelaVietnamWest IndiesWestern AfricaWestern AsiaWestern EuropeYemenZaireZimbabweAzores
Disability Age Under 5
Income
Poverty
Unemployment
Labor Participation
Family Structure
Vehicle Availability
Education Level
Disability

Osage Disability Age Under 5
Tragic

1.8%
DISABILITY | AGE UNDER 5
0.0/ 100
METRIC RATING
327th/ 347
METRIC RANK

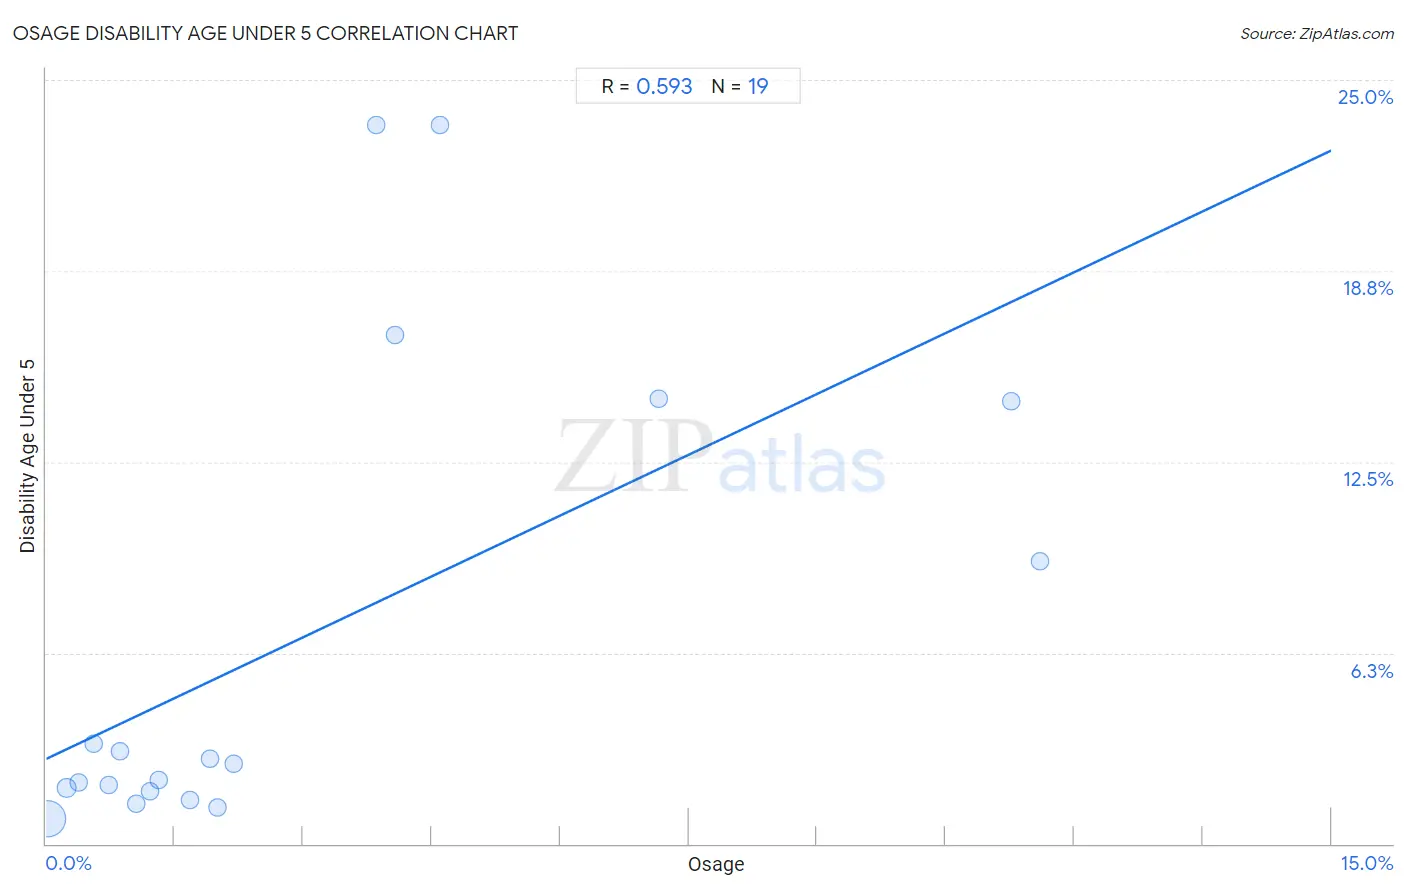
Osage Disability Age Under 5 Correlation Chart

The statistical analysis conducted on geographies consisting of 73,230,866 people shows a substantial positive correlation between the proportion of Osage and percentage of population with a disability under the age of 5 in the United States with a correlation coefficient (R) of 0.593 and weighted average of 1.8%. On average, for every 1% (one percent) increase in Osage within a typical geography, there is an increase of 1.3% in percentage of population with a disability under the age of 5.
Osage Disability Age Under 5
It is essential to understand that the correlation between the percentage of Osage and percentage of population with a disability under the age of 5 does not imply a direct cause-and-effect relationship. It remains uncertain whether the presence of Osage influences an upward or downward trend in the level of percentage of population with a disability under the age of 5 within an area, or if Osage simply ended up residing in those areas with higher or lower levels of percentage of population with a disability under the age of 5 due to other factors.

Demographics Similar to Osage by Disability Age Under 5

In terms of disability age under 5, the demographic groups most similar to Osage are Sioux (1.8%, a difference of 0.39%), American (1.9%, a difference of 1.7%), Immigrants from Portugal (1.8%, a difference of 1.8%), Houma (1.9%, a difference of 2.2%), and Choctaw (1.9%, a difference of 2.5%).
DemographicsRating | RankDisability Age Under 5
Scotch-Irish
0.0
/100
|
#320
Tragic
1.7%
Ottawa
0.0
/100
|
#321
Tragic
1.7%
Germans
0.0
/100
|
#322
Tragic
1.7%
Chickasaw
0.0
/100
|
#323
Tragic
1.7%
Cherokee
0.0
/100
|
#324
Tragic
1.8%
Immigrants from Portugal
0.0
/100
|
#325
Tragic
1.8%
Sioux
0.0
/100
|
#326
Tragic
1.8%
Osage
0.0
/100
|
#327
Tragic
1.8%
Americans
0.0
/100
|
#328
Tragic
1.9%
Houma
0.0
/100
|
#329
Tragic
1.9%
Choctaw
0.0
/100
|
#330
Tragic
1.9%
French Canadians
0.0
/100
|
#331
Tragic
1.9%
Chippewa
0.0
/100
|
#332
Tragic
1.9%
Dutch West Indians
0.0
/100
|
#333
Tragic
1.9%
Natives/Alaskans
0.0
/100
|
#334
Tragic
1.9%

Osage Disability Age Under 5 Correlation Summary

MeasurementOsage DataDisability Age Under 5 Data
Minimum0.015%0.80%
Maximum11.6%23.5%
Range11.6%22.7%
Mean3.0%6.7%
Median1.7%2.6%
Interquartile 25% (IQ1)0.72%1.7%
Interquartile 75% (IQ3)4.1%14.5%
Interquartile Range (IQR)3.4%12.8%
Standard Deviation (Sample)3.5%7.8%
Standard Deviation (Population)3.4%7.6%

Correlation Details

Osage PercentileSample SizeDisability Age Under 5
[
0.0%
-
0.5%
]
0.015%
70,913,8100.80%
[
0.0%
-
0.5%
]
0.24%
1,570,2961.8%
[
0.0%
-
0.5%
]
0.38%
362,8542.0%
[
0.5%
-
1.0%
]
0.55%
93,9813.3%
[
0.5%
-
1.0%
]
0.72%
68,3801.9%
[
0.5%
-
1.0%
]
0.86%
69,2343.0%
[
1.0%
-
1.5%
]
1.06%
75,8961.3%
[
1.0%
-
1.5%
]
1.21%
5,4501.7%
[
1.0%
-
1.5%
]
1.32%
30,6022.1%
[
1.5%
-
2.0%
]
1.68%
15,2281.4%
[
1.5%
-
2.0%
]
1.92%
8862.8%
[
1.5%
-
2.0%
]
1.99%
8,0731.2%
[
2.0%
-
2.5%
]
2.19%
6,6792.6%
[
3.5%
-
4.0%
]
3.85%
28623.5%
[
4.0%
-
4.5%
]
4.08%
36816.7%
[
4.5%
-
5.0%
]
4.60%
23923.5%
[
7.0%
-
7.5%
]
7.14%
81214.6%
[
11.0%
-
11.5%
]
11.27%
3,00914.5%
[
11.5%
-
12.0%
]
11.60%
4,7839.3%