Osage Disability
COMPARE
Osage
Select to Compare
Disability
Osage Disability
14.2%
DISABILITY
0.0/ 100
METRIC RATING
326th/ 347
METRIC RANK
Osage Disability Correlation Chart
The statistical analysis conducted on geographies consisting of 91,799,709 people shows a poor positive correlation between the proportion of Osage and percentage of population with a disability in the United States with a correlation coefficient (R) of 0.107 and weighted average of 14.2%. On average, for every 1% (one percent) increase in Osage within a typical geography, there is an increase of 0.085% in percentage of population with a disability.
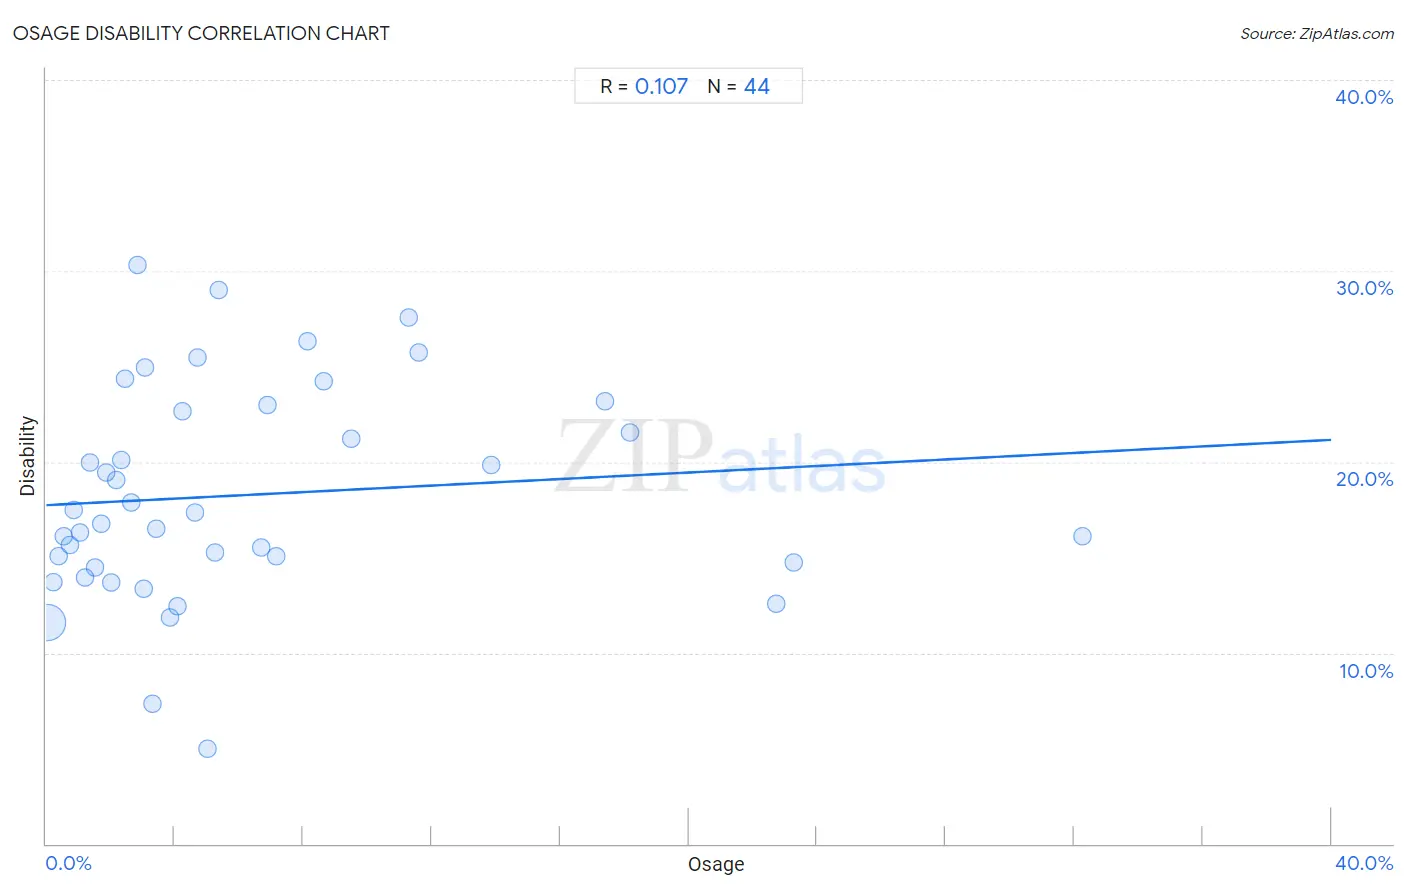
It is essential to understand that the correlation between the percentage of Osage and percentage of population with a disability does not imply a direct cause-and-effect relationship. It remains uncertain whether the presence of Osage influences an upward or downward trend in the level of percentage of population with a disability within an area, or if Osage simply ended up residing in those areas with higher or lower levels of percentage of population with a disability due to other factors.
Demographics Similar to Osage by Disability
In terms of disability, the demographic groups most similar to Osage are Ottawa (14.2%, a difference of 0.020%), Immigrants from the Azores (14.2%, a difference of 0.020%), Native/Alaskan (14.2%, a difference of 0.030%), Chippewa (14.1%, a difference of 0.080%), and Potawatomi (14.2%, a difference of 0.14%).
| Demographics | Rating | Rank | Disability |
| Iroquois | 0.0 /100 | #319 | Tragic 13.8% |
| Apache | 0.0 /100 | #320 | Tragic 13.9% |
| Paiute | 0.0 /100 | #321 | Tragic 13.9% |
| Americans | 0.0 /100 | #322 | Tragic 13.9% |
| Comanche | 0.0 /100 | #323 | Tragic 14.1% |
| Chippewa | 0.0 /100 | #324 | Tragic 14.1% |
| Natives/Alaskans | 0.0 /100 | #325 | Tragic 14.2% |
| Osage | 0.0 /100 | #326 | Tragic 14.2% |
| Ottawa | 0.0 /100 | #327 | Tragic 14.2% |
| Immigrants from the Azores | 0.0 /100 | #328 | Tragic 14.2% |
| Potawatomi | 0.0 /100 | #329 | Tragic 14.2% |
| Navajo | 0.0 /100 | #330 | Tragic 14.3% |
| Alaskan Athabascans | 0.0 /100 | #331 | Tragic 14.4% |
| Pueblo | 0.0 /100 | #332 | Tragic 14.4% |
| Cajuns | 0.0 /100 | #333 | Tragic 14.6% |
Osage Disability Correlation Summary
| Measurement | Osage Data | Disability Data |
| Minimum | 0.021% | 5.0% |
| Maximum | 32.3% | 30.3% |
| Range | 32.2% | 25.3% |
| Mean | 6.2% | 18.3% |
| Median | 3.6% | 17.0% |
| Interquartile 25% (IQ1) | 1.8% | 14.6% |
| Interquartile 75% (IQ3) | 7.7% | 22.8% |
| Interquartile Range (IQR) | 5.9% | 8.2% |
| Standard Deviation (Sample) | 7.0% | 5.6% |
| Standard Deviation (Population) | 6.9% | 5.6% |
Correlation Details
| Osage Percentile | Sample Size | Disability |
[ 0.0% - 0.5% ] 0.021% | 86,865,417 | 11.6% |
[ 0.0% - 0.5% ] 0.23% | 3,079,340 | 13.7% |
[ 0.0% - 0.5% ] 0.39% | 828,674 | 15.0% |
[ 0.5% - 1.0% ] 0.55% | 255,311 | 16.1% |
[ 0.5% - 1.0% ] 0.73% | 174,180 | 15.6% |
[ 0.5% - 1.0% ] 0.86% | 127,054 | 17.5% |
[ 1.0% - 1.5% ] 1.04% | 159,619 | 16.3% |
[ 1.0% - 1.5% ] 1.21% | 55,912 | 13.9% |
[ 1.0% - 1.5% ] 1.34% | 43,058 | 20.0% |
[ 1.5% - 2.0% ] 1.51% | 26,487 | 14.5% |
[ 1.5% - 2.0% ] 1.71% | 65,772 | 16.8% |
[ 1.5% - 2.0% ] 1.87% | 5,815 | 19.5% |
[ 2.0% - 2.5% ] 2.04% | 21,909 | 13.7% |
[ 2.0% - 2.5% ] 2.18% | 8,659 | 19.1% |
[ 2.0% - 2.5% ] 2.32% | 4,011 | 20.1% |
[ 2.0% - 2.5% ] 2.46% | 1,384 | 24.3% |
[ 2.5% - 3.0% ] 2.63% | 4,758 | 17.9% |
[ 2.5% - 3.0% ] 2.83% | 1,095 | 30.3% |
[ 3.0% - 3.5% ] 3.03% | 6,727 | 13.4% |
[ 3.0% - 3.5% ] 3.08% | 389 | 24.9% |
[ 3.0% - 3.5% ] 3.30% | 3,027 | 7.3% |
[ 3.0% - 3.5% ] 3.42% | 14,990 | 16.5% |
[ 3.5% - 4.0% ] 3.84% | 1,486 | 11.8% |
[ 4.0% - 4.5% ] 4.10% | 6,733 | 12.4% |
[ 4.0% - 4.5% ] 4.25% | 424 | 22.6% |
[ 4.5% - 5.0% ] 4.62% | 715 | 17.3% |
[ 4.5% - 5.0% ] 4.72% | 106 | 25.5% |
[ 5.0% - 5.5% ] 5.00% | 40 | 5.0% |
[ 5.0% - 5.5% ] 5.26% | 11,832 | 15.3% |
[ 5.0% - 5.5% ] 5.38% | 93 | 29.0% |
[ 6.5% - 7.0% ] 6.70% | 895 | 15.5% |
[ 6.5% - 7.0% ] 6.90% | 87 | 23.0% |
[ 7.0% - 7.5% ] 7.17% | 1,130 | 15.0% |
[ 8.0% - 8.5% ] 8.15% | 3,327 | 26.3% |
[ 8.5% - 9.0% ] 8.62% | 4,140 | 24.2% |
[ 9.0% - 9.5% ] 9.48% | 2,058 | 21.2% |
[ 11.0% - 11.5% ] 11.27% | 3,009 | 27.6% |
[ 11.5% - 12.0% ] 11.60% | 4,905 | 25.7% |
[ 13.5% - 14.0% ] 13.84% | 1,662 | 19.9% |
[ 17.0% - 17.5% ] 17.40% | 1,592 | 23.2% |
[ 18.0% - 18.5% ] 18.17% | 1,172 | 21.5% |
[ 22.5% - 23.0% ] 22.72% | 493 | 12.6% |
[ 23.0% - 23.5% ] 23.26% | 129 | 14.7% |
[ 32.0% - 32.5% ] 32.26% | 93 | 16.1% |