Nigerian 4 or more Vehicles in Household

COMPARE

Nigerian
Race
Ancestry
AfghanAfricanAlaska NativeAlaskan AthabascanAlbanianAleutAlsatianAmericanApacheArabArapahoArgentineanArmenianAssyrian/Chaldean/SyriacAustralianAustrianBahamianBangladeshiBarbadianBasqueBelgianBelizeanBermudanBhutaneseBlackfeetBolivianBrazilianBritishBritish West IndianBulgarianBurmeseCajunCambodianCanadianCape VerdeanCarpatho RusynCelticCentral AmericanCentral American IndianCherokeeCheyenneChickasawChileanChineseChippewaChoctawColombianColvilleComancheCosta RicanCreeCreekCroatianCrowCubanCypriotCzechCzechoslovakianDanishDelawareDominicanDutchDutch West IndianEastern EuropeanEcuadorianEgyptianEnglishEstonianEthiopianEuropeanFijianFilipinoFinnishFrenchFrench American IndianFrench CanadianGermanGerman RussianGhanaianGreekGuamanian/ChamorroGuatemalanGuyaneseHaitianHmongHonduranHopiHoumaHungarianIcelanderIndian (Asian)IndonesianInupiatIranianIraqiIrishIroquoisIsraeliItalianJamaicanJapaneseJordanianKenyanKiowaKoreanLaotianLatvianLebaneseLiberianLithuanianLumbeeLuxembourgerMacedonianMalaysianMalteseMarshalleseMenomineeMexicanMexican American IndianMongolianMoroccanNative HawaiianNavajoNepaleseNew ZealanderNicaraguanNigerianNorthern EuropeanNorwegianOkinawanOsageOttawaPaiutePakistaniPalestinianPanamanianParaguayanPennsylvania GermanPeruvianPimaPolishPortuguesePotawatomiPuebloPuerto RicanPuget Sound SalishRomanianRussianSalvadoranSamoanScandinavianScotch-IrishScottishSeminoleSenegaleseSerbianShoshoneSierra LeoneanSiouxSlavicSlovakSloveneSomaliSouth AfricanSouth AmericanSouth American IndianSoviet UnionSpaniardSpanishSpanish AmericanSpanish American IndianSri LankanSubsaharan AfricanSudaneseSwedishSwissSyrianTaiwaneseThaiTlingit-HaidaTohono O'OdhamTonganTrinidadian and TobagonianTsimshianTurkishU.S. Virgin IslanderUgandanUkrainianUruguayanUteVenezuelanVietnameseWelshWest IndianYakamaYaquiYugoslavianYumanYup'ikZimbabwean
Immigration
NonimmigrantsImmigrantsAfghanistanAfricaAlbaniaArgentinaArmeniaAsiaAustraliaAustriaBahamasBangladeshBarbadosBelarusBelgiumBelizeBoliviaBosnia and HerzegovinaBrazilBulgariaBurma/MyanmarCabo VerdeCambodiaCameroonCanadaCaribbeanCentral AmericaChileChinaColombiaCongoCosta RicaCroatiaCubaCzechoslovakiaDenmarkDominicaDominican RepublicEastern AfricaEastern AsiaEastern EuropeEcuadorEgyptEl SalvadorEnglandEritreaEthiopiaEuropeFijiFranceGermanyGhanaGreeceGrenadaGuatemalaGuyanaHaitiHondurasHong KongHungaryIndiaIndonesiaIranIraqIrelandIsraelItalyJamaicaJapanJordanKazakhstanKenyaKoreaKuwaitLaosLatin AmericaLatviaLebanonLiberiaLithuaniaMalaysiaMexicoMicronesiaMiddle AfricaMoldovaMoroccoNepalNetherlandsNicaraguaNigeriaNorth AmericaNorth MacedoniaNorthern AfricaNorthern EuropeNorwayOceaniaPakistanPanamaPeruPhilippinesPolandPortugalRomaniaRussiaSaudi ArabiaScotlandSenegalSerbiaSierra LeoneSingaporeSomaliaSouth AfricaSouth AmericaSouth Central AsiaSouth Eastern AsiaSouthern EuropeSpainSri LankaSt. Vincent and the GrenadinesSudanSwedenSwitzerlandSyriaTaiwanThailandTrinidad and TobagoTurkeyUgandaUkraineUruguayUzbekistanVenezuelaVietnamWest IndiesWestern AfricaWestern AsiaWestern EuropeYemenZaireZimbabweAzores
Select to Compare
Race
Ancestry
AfghanAfricanAlaska NativeAlaskan AthabascanAlbanianAleutAlsatianAmericanApacheArabArapahoArgentineanArmenianAssyrian/Chaldean/SyriacAustralianAustrianBahamianBangladeshiBarbadianBasqueBelgianBelizeanBermudanBhutaneseBlackfeetBolivianBrazilianBritishBritish West IndianBulgarianBurmeseCajunCambodianCanadianCape VerdeanCarpatho RusynCelticCentral AmericanCentral American IndianCherokeeCheyenneChickasawChileanChineseChippewaChoctawColombianColvilleComancheCosta RicanCreeCreekCroatianCrowCubanCypriotCzechCzechoslovakianDanishDelawareDominicanDutchDutch West IndianEastern EuropeanEcuadorianEgyptianEnglishEstonianEthiopianEuropeanFijianFilipinoFinnishFrenchFrench American IndianFrench CanadianGermanGerman RussianGhanaianGreekGuamanian/ChamorroGuatemalanGuyaneseHaitianHmongHonduranHopiHoumaHungarianIcelanderIndian (Asian)IndonesianInupiatIranianIraqiIrishIroquoisIsraeliItalianJamaicanJapaneseJordanianKenyanKiowaKoreanLaotianLatvianLebaneseLiberianLithuanianLumbeeLuxembourgerMacedonianMalaysianMalteseMarshalleseMenomineeMexicanMexican American IndianMongolianMoroccanNative HawaiianNavajoNepaleseNew ZealanderNicaraguanNorthern EuropeanNorwegianOkinawanOsageOttawaPaiutePakistaniPalestinianPanamanianParaguayanPennsylvania GermanPeruvianPimaPolishPortuguesePotawatomiPuebloPuerto RicanPuget Sound SalishRomanianRussianSalvadoranSamoanScandinavianScotch-IrishScottishSeminoleSenegaleseSerbianShoshoneSierra LeoneanSiouxSlavicSlovakSloveneSomaliSouth AfricanSouth AmericanSouth American IndianSoviet UnionSpaniardSpanishSpanish AmericanSpanish American IndianSri LankanSubsaharan AfricanSudaneseSwedishSwissSyrianTaiwaneseThaiTlingit-HaidaTohono O'OdhamTonganTrinidadian and TobagonianTsimshianTurkishU.S. Virgin IslanderUgandanUkrainianUruguayanUteVenezuelanVietnameseWelshWest IndianYakamaYaquiYugoslavianYumanYup'ikZimbabwean
Immigration
NonimmigrantsImmigrantsAfghanistanAfricaAlbaniaArgentinaArmeniaAsiaAustraliaAustriaBahamasBangladeshBarbadosBelarusBelgiumBelizeBoliviaBosnia and HerzegovinaBrazilBulgariaBurma/MyanmarCabo VerdeCambodiaCameroonCanadaCaribbeanCentral AmericaChileChinaColombiaCongoCosta RicaCroatiaCubaCzechoslovakiaDenmarkDominicaDominican RepublicEastern AfricaEastern AsiaEastern EuropeEcuadorEgyptEl SalvadorEnglandEritreaEthiopiaEuropeFijiFranceGermanyGhanaGreeceGrenadaGuatemalaGuyanaHaitiHondurasHong KongHungaryIndiaIndonesiaIranIraqIrelandIsraelItalyJamaicaJapanJordanKazakhstanKenyaKoreaKuwaitLaosLatin AmericaLatviaLebanonLiberiaLithuaniaMalaysiaMexicoMicronesiaMiddle AfricaMoldovaMoroccoNepalNetherlandsNicaraguaNigeriaNorth AmericaNorth MacedoniaNorthern AfricaNorthern EuropeNorwayOceaniaPakistanPanamaPeruPhilippinesPolandPortugalRomaniaRussiaSaudi ArabiaScotlandSenegalSerbiaSierra LeoneSingaporeSomaliaSouth AfricaSouth AmericaSouth Central AsiaSouth Eastern AsiaSouthern EuropeSpainSri LankaSt. Vincent and the GrenadinesSudanSwedenSwitzerlandSyriaTaiwanThailandTrinidad and TobagoTurkeyUgandaUkraineUruguayUzbekistanVenezuelaVietnamWest IndiesWestern AfricaWestern AsiaWestern EuropeYemenZaireZimbabweAzores
4 or more Vehicles in Household
Income
Poverty
Unemployment
Labor Participation
Family Structure
Vehicle Availability
Education Level
Disability

Nigerian 4 or more Vehicles in Household
Poor

6.0%
4+ VEHICLES AVAILABLE
12.2/ 100
METRIC RATING
217th/ 347
METRIC RANK

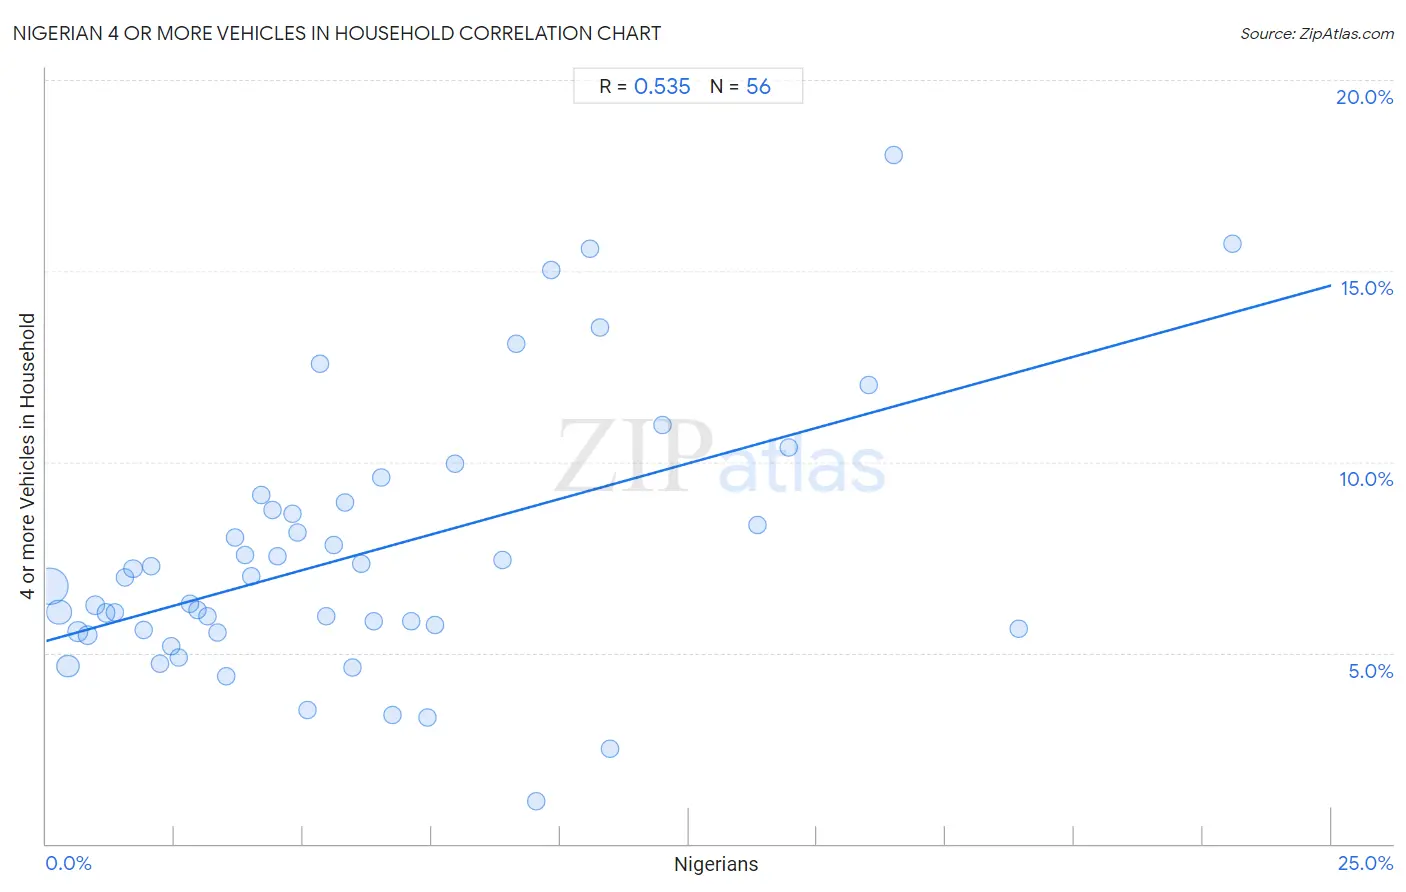
Nigerian 4 or more Vehicles in Household Correlation Chart

The statistical analysis conducted on geographies consisting of 331,155,692 people shows a substantial positive correlation between the proportion of Nigerians and percentage of households with 4 or more vehicles available in the United States with a correlation coefficient (R) of 0.535 and weighted average of 6.0%. On average, for every 1% (one percent) increase in Nigerians within a typical geography, there is an increase of 0.37% in percentage of households with 4 or more vehicles available.
Nigerian 4 or more Vehicles in Household
It is essential to understand that the correlation between the percentage of Nigerians and percentage of households with 4 or more vehicles available does not imply a direct cause-and-effect relationship. It remains uncertain whether the presence of Nigerians influences an upward or downward trend in the level of percentage of households with 4 or more vehicles available within an area, or if Nigerians simply ended up residing in those areas with higher or lower levels of percentage of households with 4 or more vehicles available due to other factors.

Demographics Similar to Nigerians by 4 or more Vehicles in Household

In terms of 4 or more vehicles in household, the demographic groups most similar to Nigerians are Immigrants from Italy (6.0%, a difference of 0.31%), Serbian (6.0%, a difference of 0.31%), Immigrants from China (6.0%, a difference of 0.39%), Immigrants from Romania (6.0%, a difference of 0.39%), and Immigrants from Austria (6.0%, a difference of 0.50%).
DemographicsRating | Rank4 or more Vehicles in Household
Immigrants from Zimbabwe
15.1
/100
|
#210
Poor
6.0%
Panamanians
14.8
/100
|
#211
Poor
6.0%
Immigrants from Egypt
14.7
/100
|
#212
Poor
6.0%
Arabs
14.4
/100
|
#213
Poor
6.0%
Immigrants from Austria
14.3
/100
|
#214
Poor
6.0%
Immigrants from China
13.8
/100
|
#215
Poor
6.0%
Immigrants from Romania
13.8
/100
|
#216
Poor
6.0%
Nigerians
12.2
/100
|
#217
Poor
6.0%
Immigrants from Italy
11.0
/100
|
#218
Poor
6.0%
Serbians
11.0
/100
|
#219
Poor
6.0%
Russians
10.3
/100
|
#220
Poor
6.0%
Immigrants from Moldova
9.3
/100
|
#221
Tragic
6.0%
Cajuns
9.2
/100
|
#222
Tragic
6.0%
Immigrants from Kenya
9.2
/100
|
#223
Tragic
6.0%
Cubans
9.2
/100
|
#224
Tragic
6.0%

Nigerian 4 or more Vehicles in Household Correlation Summary

MeasurementNigerian Data4 or more Vehicles in Household Data
Minimum0.080%1.1%
Maximum23.1%18.0%
Range23.0%16.9%
Mean6.1%7.6%
Median5.0%6.9%
Interquartile 25% (IQ1)2.5%5.6%
Interquartile 75% (IQ3)8.4%8.8%
Interquartile Range (IQR)5.9%3.3%
Standard Deviation (Sample)5.0%3.5%
Standard Deviation (Population)4.9%3.4%

Correlation Details

Nigerian PercentileSample Size4 or more Vehicles in Household
[
0.0%
-
0.5%
]
0.080%
177,466,6986.7%
[
0.0%
-
0.5%
]
0.25%
65,413,6386.1%
[
0.0%
-
0.5%
]
0.42%
38,685,9284.6%
[
0.5%
-
1.0%
]
0.61%
17,120,2805.6%
[
0.5%
-
1.0%
]
0.81%
9,140,9635.5%
[
0.5%
-
1.0%
]
0.96%
7,725,6776.2%
[
1.0%
-
1.5%
]
1.17%
3,789,6696.0%
[
1.0%
-
1.5%
]
1.34%
2,874,5906.0%
[
1.5%
-
2.0%
]
1.53%
1,290,0137.0%
[
1.5%
-
2.0%
]
1.69%
1,323,7747.2%
[
1.5%
-
2.0%
]
1.90%
800,0625.6%
[
2.0%
-
2.5%
]
2.04%
808,3297.3%
[
2.0%
-
2.5%
]
2.22%
793,8114.7%
[
2.0%
-
2.5%
]
2.43%
615,0585.2%
[
2.5%
-
3.0%
]
2.59%
324,1464.9%
[
2.5%
-
3.0%
]
2.79%
201,2716.3%
[
2.5%
-
3.0%
]
2.95%
298,2376.1%
[
3.0%
-
3.5%
]
3.14%
220,5175.9%
[
3.0%
-
3.5%
]
3.32%
194,1735.5%
[
3.0%
-
3.5%
]
3.49%
207,3684.4%
[
3.5%
-
4.0%
]
3.68%
141,6528.0%
[
3.5%
-
4.0%
]
3.86%
79,1497.6%
[
3.5%
-
4.0%
]
3.98%
184,3877.0%
[
4.0%
-
4.5%
]
4.18%
205,7869.1%
[
4.0%
-
4.5%
]
4.41%
68,5998.7%
[
4.5%
-
5.0%
]
4.50%
92,0987.5%
[
4.5%
-
5.0%
]
4.79%
92,1248.6%
[
4.5%
-
5.0%
]
4.88%
181,3298.1%
[
5.0%
-
5.5%
]
5.08%
1,5753.5%
[
5.0%
-
5.5%
]
5.31%
42,76712.6%
[
5.0%
-
5.5%
]
5.44%
96,7866.0%
[
5.5%
-
6.0%
]
5.60%
110,0997.8%
[
5.5%
-
6.0%
]
5.82%
69,7318.9%
[
5.5%
-
6.0%
]
5.95%
70,1974.6%
[
6.0%
-
6.5%
]
6.13%
22,3407.3%
[
6.0%
-
6.5%
]
6.37%
8,2055.8%
[
6.5%
-
7.0%
]
6.51%
123,1359.6%
[
6.5%
-
7.0%
]
6.75%
47,9673.4%
[
7.0%
-
7.5%
]
7.10%
3105.8%
[
7.0%
-
7.5%
]
7.41%
5263.3%
[
7.5%
-
8.0%
]
7.56%
55,8765.7%
[
7.5%
-
8.0%
]
7.95%
6679.9%
[
8.5%
-
9.0%
]
8.88%
116,4637.4%
[
9.0%
-
9.5%
]
9.15%
2,35113.1%
[
9.5%
-
10.0%
]
9.54%
12,4871.1%
[
9.5%
-
10.0%
]
9.83%
2,29915.0%
[
10.5%
-
11.0%
]
10.58%
4,37515.6%
[
10.5%
-
11.0%
]
10.77%
13013.5%
[
10.5%
-
11.0%
]
10.97%
1,0302.5%
[
12.0%
-
12.5%
]
12.00%
1,87511.0%
[
13.5%
-
14.0%
]
13.85%
13,1928.4%
[
14.0%
-
14.5%
]
14.44%
2,34810.4%
[
15.5%
-
16.0%
]
15.99%
3,91412.0%
[
16.0%
-
16.5%
]
16.48%
18218.0%
[
18.5%
-
19.0%
]
18.91%
5,3315.6%
[
23.0%
-
23.5%
]
23.08%
20815.7%