Nigerian Married-couple Households
COMPARE
Nigerian
Select to Compare
Married-couple Households
Nigerian Married-couple Households
43.2%
MARRIED-COUPLE HOUSEHOLDS
0.1/ 100
METRIC RATING
274th/ 347
METRIC RANK
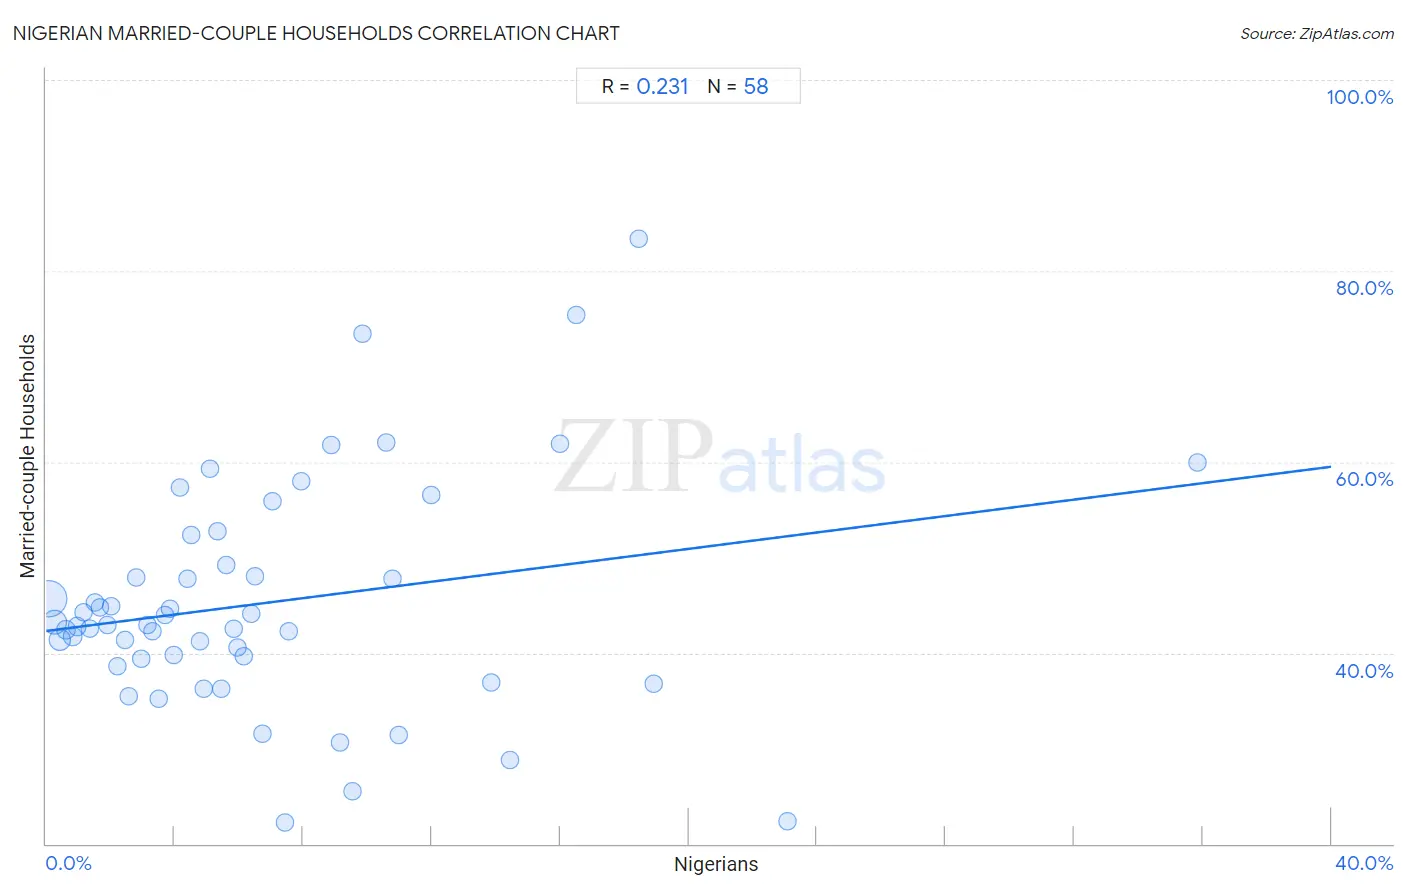
Nigerian Married-couple Households Correlation Chart
The statistical analysis conducted on geographies consisting of 332,444,771 people shows a weak positive correlation between the proportion of Nigerians and percentage of married-couple family households in the United States with a correlation coefficient (R) of 0.231 and weighted average of 43.2%. On average, for every 1% (one percent) increase in Nigerians within a typical geography, there is an increase of 0.43% in percentage of married-couple family households.
It is essential to understand that the correlation between the percentage of Nigerians and percentage of married-couple family households does not imply a direct cause-and-effect relationship. It remains uncertain whether the presence of Nigerians influences an upward or downward trend in the level of percentage of married-couple family households within an area, or if Nigerians simply ended up residing in those areas with higher or lower levels of percentage of married-couple family households due to other factors.
Demographics Similar to Nigerians by Married-couple Households
In terms of married-couple households, the demographic groups most similar to Nigerians are Ethiopian (43.2%, a difference of 0.010%), Immigrants from Nigeria (43.2%, a difference of 0.11%), Immigrants from Bangladesh (43.1%, a difference of 0.14%), Guatemalan (43.3%, a difference of 0.21%), and Immigrants from Ethiopia (43.1%, a difference of 0.25%).
| Demographics | Rating | Rank | Married-couple Households |
| Natives/Alaskans | 0.1 /100 | #267 | Tragic 43.5% |
| Immigrants from Burma/Myanmar | 0.1 /100 | #268 | Tragic 43.4% |
| Immigrants from Sierra Leone | 0.1 /100 | #269 | Tragic 43.3% |
| Yuman | 0.1 /100 | #270 | Tragic 43.3% |
| Guatemalans | 0.1 /100 | #271 | Tragic 43.3% |
| Immigrants from Nigeria | 0.1 /100 | #272 | Tragic 43.2% |
| Ethiopians | 0.1 /100 | #273 | Tragic 43.2% |
| Nigerians | 0.1 /100 | #274 | Tragic 43.2% |
| Immigrants from Bangladesh | 0.0 /100 | #275 | Tragic 43.1% |
| Immigrants from Ethiopia | 0.0 /100 | #276 | Tragic 43.1% |
| Immigrants from Eastern Africa | 0.0 /100 | #277 | Tragic 42.9% |
| Immigrants from Africa | 0.0 /100 | #278 | Tragic 42.9% |
| Sierra Leoneans | 0.0 /100 | #279 | Tragic 42.9% |
| Immigrants from Ecuador | 0.0 /100 | #280 | Tragic 42.9% |
| Immigrants from Guatemala | 0.0 /100 | #281 | Tragic 42.8% |
Nigerian Married-couple Households Correlation Summary
| Measurement | Nigerian Data | Married-couple Households Data |
| Minimum | 0.080% | 22.2% |
| Maximum | 35.8% | 83.4% |
| Range | 35.7% | 61.2% |
| Mean | 6.9% | 45.2% |
| Median | 5.2% | 42.9% |
| Interquartile 25% (IQ1) | 2.6% | 39.4% |
| Interquartile 75% (IQ3) | 9.1% | 49.2% |
| Interquartile Range (IQR) | 6.6% | 9.7% |
| Standard Deviation (Sample) | 6.4% | 12.0% |
| Standard Deviation (Population) | 6.4% | 11.9% |
Correlation Details
| Nigerian Percentile | Sample Size | Married-couple Households |
[ 0.0% - 0.5% ] 0.080% | 178,180,501 | 45.6% |
[ 0.0% - 0.5% ] 0.25% | 65,654,942 | 43.2% |
[ 0.0% - 0.5% ] 0.42% | 38,758,827 | 41.4% |
[ 0.5% - 1.0% ] 0.61% | 17,201,122 | 42.4% |
[ 0.5% - 1.0% ] 0.81% | 9,183,047 | 41.7% |
[ 0.5% - 1.0% ] 0.96% | 7,768,778 | 42.7% |
[ 1.0% - 1.5% ] 1.17% | 3,807,964 | 44.3% |
[ 1.0% - 1.5% ] 1.34% | 2,893,308 | 42.5% |
[ 1.5% - 2.0% ] 1.53% | 1,310,931 | 45.2% |
[ 1.5% - 2.0% ] 1.69% | 1,320,798 | 44.8% |
[ 1.5% - 2.0% ] 1.90% | 827,158 | 43.0% |
[ 2.0% - 2.5% ] 2.04% | 808,329 | 44.9% |
[ 2.0% - 2.5% ] 2.22% | 795,469 | 38.6% |
[ 2.0% - 2.5% ] 2.43% | 615,058 | 41.3% |
[ 2.5% - 3.0% ] 2.59% | 324,855 | 35.4% |
[ 2.5% - 3.0% ] 2.79% | 201,517 | 47.9% |
[ 2.5% - 3.0% ] 2.95% | 298,237 | 39.4% |
[ 3.0% - 3.5% ] 3.14% | 220,517 | 42.9% |
[ 3.0% - 3.5% ] 3.32% | 194,173 | 42.3% |
[ 3.0% - 3.5% ] 3.49% | 207,480 | 35.2% |
[ 3.5% - 4.0% ] 3.68% | 141,652 | 44.0% |
[ 3.5% - 4.0% ] 3.86% | 81,445 | 44.6% |
[ 3.5% - 4.0% ] 3.98% | 184,387 | 39.8% |
[ 4.0% - 4.5% ] 4.18% | 205,786 | 57.3% |
[ 4.0% - 4.5% ] 4.41% | 68,599 | 47.7% |
[ 4.5% - 5.0% ] 4.50% | 92,098 | 52.3% |
[ 4.5% - 5.0% ] 4.79% | 92,124 | 41.3% |
[ 4.5% - 5.0% ] 4.88% | 181,329 | 36.2% |
[ 5.0% - 5.5% ] 5.08% | 1,575 | 59.3% |
[ 5.0% - 5.5% ] 5.31% | 43,686 | 52.8% |
[ 5.0% - 5.5% ] 5.44% | 97,100 | 36.3% |
[ 5.5% - 6.0% ] 5.60% | 110,099 | 49.2% |
[ 5.5% - 6.0% ] 5.82% | 70,078 | 42.6% |
[ 5.5% - 6.0% ] 5.95% | 70,197 | 40.5% |
[ 6.0% - 6.5% ] 6.15% | 26,141 | 39.6% |
[ 6.0% - 6.5% ] 6.37% | 8,205 | 44.1% |
[ 6.5% - 7.0% ] 6.51% | 123,135 | 48.0% |
[ 6.5% - 7.0% ] 6.75% | 47,967 | 31.5% |
[ 7.0% - 7.5% ] 7.05% | 723 | 55.8% |
[ 7.0% - 7.5% ] 7.41% | 526 | 22.2% |
[ 7.5% - 8.0% ] 7.56% | 55,876 | 42.2% |
[ 7.5% - 8.0% ] 7.95% | 667 | 58.0% |
[ 8.5% - 9.0% ] 8.88% | 116,587 | 61.7% |
[ 9.0% - 9.5% ] 9.15% | 2,351 | 30.6% |
[ 9.5% - 10.0% ] 9.54% | 12,487 | 25.5% |
[ 9.5% - 10.0% ] 9.83% | 2,299 | 73.4% |
[ 10.5% - 11.0% ] 10.58% | 4,375 | 62.0% |
[ 10.5% - 11.0% ] 10.78% | 1,382 | 47.7% |
[ 10.5% - 11.0% ] 10.97% | 1,030 | 31.4% |
[ 12.0% - 12.5% ] 12.00% | 1,875 | 56.5% |
[ 13.5% - 14.0% ] 13.85% | 13,192 | 36.9% |
[ 14.0% - 14.5% ] 14.44% | 2,348 | 28.8% |
[ 15.5% - 16.0% ] 15.99% | 3,914 | 61.9% |
[ 16.0% - 16.5% ] 16.48% | 182 | 75.4% |
[ 18.0% - 18.5% ] 18.45% | 737 | 83.4% |
[ 18.5% - 19.0% ] 18.91% | 5,331 | 36.8% |
[ 23.0% - 23.5% ] 23.08% | 208 | 22.3% |
[ 35.5% - 36.0% ] 35.82% | 67 | 60.0% |