Nigerian Married-Couple Family Poverty

COMPARE

Nigerian
Race
Ancestry
AfghanAfricanAlaska NativeAlaskan AthabascanAlbanianAleutAlsatianAmericanApacheArabArapahoArgentineanArmenianAssyrian/Chaldean/SyriacAustralianAustrianBahamianBangladeshiBarbadianBasqueBelgianBelizeanBermudanBhutaneseBlackfeetBolivianBrazilianBritishBritish West IndianBulgarianBurmeseCajunCambodianCanadianCape VerdeanCarpatho RusynCelticCentral AmericanCentral American IndianCherokeeCheyenneChickasawChileanChineseChippewaChoctawColombianColvilleComancheCosta RicanCreeCreekCroatianCrowCubanCypriotCzechCzechoslovakianDanishDelawareDominicanDutchDutch West IndianEastern EuropeanEcuadorianEgyptianEnglishEstonianEthiopianEuropeanFijianFilipinoFinnishFrenchFrench American IndianFrench CanadianGermanGerman RussianGhanaianGreekGuamanian/ChamorroGuatemalanGuyaneseHaitianHmongHonduranHopiHoumaHungarianIcelanderIndian (Asian)IndonesianInupiatIranianIraqiIrishIroquoisIsraeliItalianJamaicanJapaneseJordanianKenyanKiowaKoreanLaotianLatvianLebaneseLiberianLithuanianLumbeeLuxembourgerMacedonianMalaysianMalteseMarshalleseMenomineeMexicanMexican American IndianMongolianMoroccanNative HawaiianNavajoNepaleseNew ZealanderNicaraguanNigerianNorthern EuropeanNorwegianOkinawanOsageOttawaPaiutePakistaniPalestinianPanamanianParaguayanPennsylvania GermanPeruvianPimaPolishPortuguesePotawatomiPuebloPuerto RicanPuget Sound SalishRomanianRussianSalvadoranSamoanScandinavianScotch-IrishScottishSeminoleSenegaleseSerbianShoshoneSierra LeoneanSiouxSlavicSlovakSloveneSomaliSouth AfricanSouth AmericanSouth American IndianSoviet UnionSpaniardSpanishSpanish AmericanSpanish American IndianSri LankanSubsaharan AfricanSudaneseSwedishSwissSyrianTaiwaneseThaiTlingit-HaidaTohono O'OdhamTonganTrinidadian and TobagonianTsimshianTurkishU.S. Virgin IslanderUgandanUkrainianUruguayanUteVenezuelanVietnameseWelshWest IndianYakamaYaquiYugoslavianYumanYup'ikZimbabwean
Immigration
NonimmigrantsImmigrantsAfghanistanAfricaAlbaniaArgentinaArmeniaAsiaAustraliaAustriaBahamasBangladeshBarbadosBelarusBelgiumBelizeBoliviaBosnia and HerzegovinaBrazilBulgariaBurma/MyanmarCabo VerdeCambodiaCameroonCanadaCaribbeanCentral AmericaChileChinaColombiaCongoCosta RicaCroatiaCubaCzechoslovakiaDenmarkDominicaDominican RepublicEastern AfricaEastern AsiaEastern EuropeEcuadorEgyptEl SalvadorEnglandEritreaEthiopiaEuropeFijiFranceGermanyGhanaGreeceGrenadaGuatemalaGuyanaHaitiHondurasHong KongHungaryIndiaIndonesiaIranIraqIrelandIsraelItalyJamaicaJapanJordanKazakhstanKenyaKoreaKuwaitLaosLatin AmericaLatviaLebanonLiberiaLithuaniaMalaysiaMexicoMicronesiaMiddle AfricaMoldovaMoroccoNepalNetherlandsNicaraguaNigeriaNorth AmericaNorth MacedoniaNorthern AfricaNorthern EuropeNorwayOceaniaPakistanPanamaPeruPhilippinesPolandPortugalRomaniaRussiaSaudi ArabiaScotlandSenegalSerbiaSierra LeoneSingaporeSomaliaSouth AfricaSouth AmericaSouth Central AsiaSouth Eastern AsiaSouthern EuropeSpainSri LankaSt. Vincent and the GrenadinesSudanSwedenSwitzerlandSyriaTaiwanThailandTrinidad and TobagoTurkeyUgandaUkraineUruguayUzbekistanVenezuelaVietnamWest IndiesWestern AfricaWestern AsiaWestern EuropeYemenZaireZimbabweAzores
Select to Compare
Race
Ancestry
AfghanAfricanAlaska NativeAlaskan AthabascanAlbanianAleutAlsatianAmericanApacheArabArapahoArgentineanArmenianAssyrian/Chaldean/SyriacAustralianAustrianBahamianBangladeshiBarbadianBasqueBelgianBelizeanBermudanBhutaneseBlackfeetBolivianBrazilianBritishBritish West IndianBulgarianBurmeseCajunCambodianCanadianCape VerdeanCarpatho RusynCelticCentral AmericanCentral American IndianCherokeeCheyenneChickasawChileanChineseChippewaChoctawColombianColvilleComancheCosta RicanCreeCreekCroatianCrowCubanCypriotCzechCzechoslovakianDanishDelawareDominicanDutchDutch West IndianEastern EuropeanEcuadorianEgyptianEnglishEstonianEthiopianEuropeanFijianFilipinoFinnishFrenchFrench American IndianFrench CanadianGermanGerman RussianGhanaianGreekGuamanian/ChamorroGuatemalanGuyaneseHaitianHmongHonduranHopiHoumaHungarianIcelanderIndian (Asian)IndonesianInupiatIranianIraqiIrishIroquoisIsraeliItalianJamaicanJapaneseJordanianKenyanKiowaKoreanLaotianLatvianLebaneseLiberianLithuanianLumbeeLuxembourgerMacedonianMalaysianMalteseMarshalleseMenomineeMexicanMexican American IndianMongolianMoroccanNative HawaiianNavajoNepaleseNew ZealanderNicaraguanNorthern EuropeanNorwegianOkinawanOsageOttawaPaiutePakistaniPalestinianPanamanianParaguayanPennsylvania GermanPeruvianPimaPolishPortuguesePotawatomiPuebloPuerto RicanPuget Sound SalishRomanianRussianSalvadoranSamoanScandinavianScotch-IrishScottishSeminoleSenegaleseSerbianShoshoneSierra LeoneanSiouxSlavicSlovakSloveneSomaliSouth AfricanSouth AmericanSouth American IndianSoviet UnionSpaniardSpanishSpanish AmericanSpanish American IndianSri LankanSubsaharan AfricanSudaneseSwedishSwissSyrianTaiwaneseThaiTlingit-HaidaTohono O'OdhamTonganTrinidadian and TobagonianTsimshianTurkishU.S. Virgin IslanderUgandanUkrainianUruguayanUteVenezuelanVietnameseWelshWest IndianYakamaYaquiYugoslavianYumanYup'ikZimbabwean
Immigration
NonimmigrantsImmigrantsAfghanistanAfricaAlbaniaArgentinaArmeniaAsiaAustraliaAustriaBahamasBangladeshBarbadosBelarusBelgiumBelizeBoliviaBosnia and HerzegovinaBrazilBulgariaBurma/MyanmarCabo VerdeCambodiaCameroonCanadaCaribbeanCentral AmericaChileChinaColombiaCongoCosta RicaCroatiaCubaCzechoslovakiaDenmarkDominicaDominican RepublicEastern AfricaEastern AsiaEastern EuropeEcuadorEgyptEl SalvadorEnglandEritreaEthiopiaEuropeFijiFranceGermanyGhanaGreeceGrenadaGuatemalaGuyanaHaitiHondurasHong KongHungaryIndiaIndonesiaIranIraqIrelandIsraelItalyJamaicaJapanJordanKazakhstanKenyaKoreaKuwaitLaosLatin AmericaLatviaLebanonLiberiaLithuaniaMalaysiaMexicoMicronesiaMiddle AfricaMoldovaMoroccoNepalNetherlandsNicaraguaNigeriaNorth AmericaNorth MacedoniaNorthern AfricaNorthern EuropeNorwayOceaniaPakistanPanamaPeruPhilippinesPolandPortugalRomaniaRussiaSaudi ArabiaScotlandSenegalSerbiaSierra LeoneSingaporeSomaliaSouth AfricaSouth AmericaSouth Central AsiaSouth Eastern AsiaSouthern EuropeSpainSri LankaSt. Vincent and the GrenadinesSudanSwedenSwitzerlandSyriaTaiwanThailandTrinidad and TobagoTurkeyUgandaUkraineUruguayUzbekistanVenezuelaVietnamWest IndiesWestern AfricaWestern AsiaWestern EuropeYemenZaireZimbabweAzores
Married-Couple Family Poverty
Income
Poverty
Unemployment
Labor Participation
Family Structure
Vehicle Availability
Education Level
Disability

Nigerian Married-Couple Family Poverty
Poor

5.5%
POVERTY | MARRIED-COUPLE FAMILIES
14.3/ 100
METRIC RATING
211th/ 347
METRIC RANK

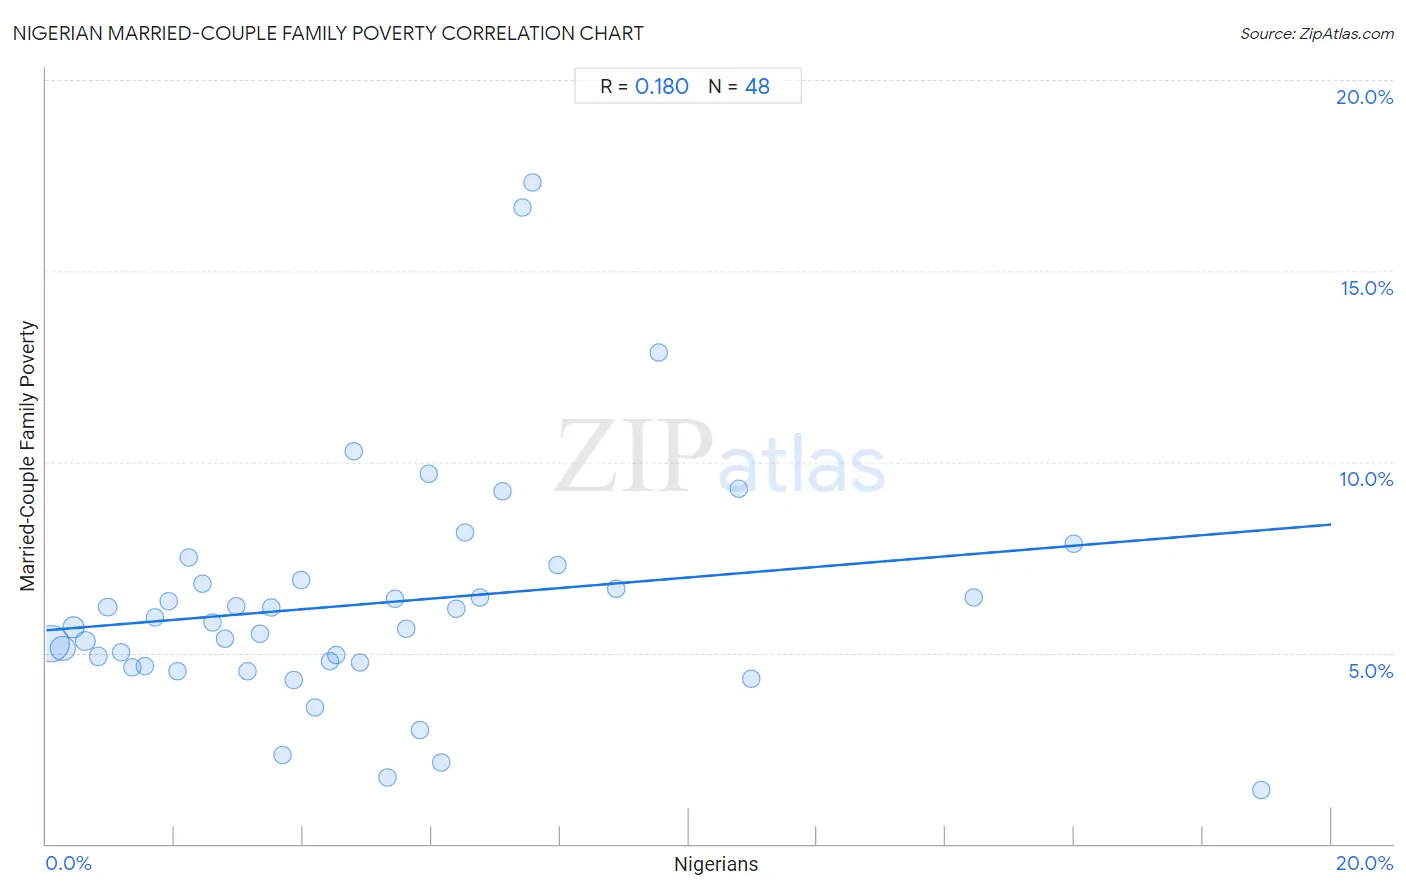
Nigerian Married-Couple Family Poverty Correlation Chart

The statistical analysis conducted on geographies consisting of 330,785,707 people shows a poor positive correlation between the proportion of Nigerians and poverty level among married-couple families in the United States with a correlation coefficient (R) of 0.180 and weighted average of 5.5%. On average, for every 1% (one percent) increase in Nigerians within a typical geography, there is an increase of 0.14% in poverty level among married-couple families.
Nigerian Married-Couple Family Poverty
It is essential to understand that the correlation between the percentage of Nigerians and poverty level among married-couple families does not imply a direct cause-and-effect relationship. It remains uncertain whether the presence of Nigerians influences an upward or downward trend in the level of poverty level among married-couple families within an area, or if Nigerians simply ended up residing in those areas with higher or lower levels of poverty level among married-couple families due to other factors.

Demographics Similar to Nigerians by Married-Couple Family Poverty

In terms of married-couple family poverty, the demographic groups most similar to Nigerians are Immigrants from Micronesia (5.5%, a difference of 0.020%), Immigrants from Thailand (5.5%, a difference of 0.070%), Immigrants from Syria (5.5%, a difference of 0.23%), Immigrants from Liberia (5.5%, a difference of 0.25%), and Iroquois (5.5%, a difference of 0.29%).
DemographicsRating | RankMarried-Couple Family Poverty
Immigrants from Costa Rica
19.4
/100
|
#204
Poor
5.4%
Chippewa
18.9
/100
|
#205
Poor
5.4%
Osage
18.4
/100
|
#206
Poor
5.4%
Immigrants from Africa
17.6
/100
|
#207
Poor
5.5%
French American Indians
16.1
/100
|
#208
Poor
5.5%
Immigrants from Syria
15.4
/100
|
#209
Poor
5.5%
Immigrants from Micronesia
14.4
/100
|
#210
Poor
5.5%
Nigerians
14.3
/100
|
#211
Poor
5.5%
Immigrants from Thailand
14.0
/100
|
#212
Poor
5.5%
Immigrants from Liberia
13.3
/100
|
#213
Poor
5.5%
Iroquois
13.1
/100
|
#214
Poor
5.5%
Armenians
12.8
/100
|
#215
Poor
5.5%
Potawatomi
12.4
/100
|
#216
Poor
5.5%
Immigrants from Nigeria
11.3
/100
|
#217
Poor
5.5%
Afghans
11.2
/100
|
#218
Poor
5.5%

Nigerian Married-Couple Family Poverty Correlation Summary

MeasurementNigerian DataMarried-Couple Family Poverty Data
Minimum0.080%1.4%
Maximum18.9%17.3%
Range18.8%15.9%
Mean5.1%6.3%
Median4.3%5.7%
Interquartile 25% (IQ1)2.1%4.7%
Interquartile 75% (IQ3)6.6%6.9%
Interquartile Range (IQR)4.5%2.1%
Standard Deviation (Sample)4.1%3.1%
Standard Deviation (Population)4.0%3.1%

Correlation Details

Nigerian PercentileSample SizeMarried-Couple Family Poverty
[
0.0%
-
0.5%
]
0.080%
177,665,4975.3%
[
0.0%
-
0.5%
]
0.25%
65,330,7055.1%
[
0.0%
-
0.5%
]
0.42%
38,562,0135.7%
[
0.5%
-
1.0%
]
0.61%
17,102,9145.3%
[
0.5%
-
1.0%
]
0.81%
9,053,5664.9%
[
0.5%
-
1.0%
]
0.96%
7,702,6226.2%
[
1.0%
-
1.5%
]
1.17%
3,735,7955.0%
[
1.0%
-
1.5%
]
1.34%
2,846,4354.6%
[
1.5%
-
2.0%
]
1.53%
1,303,5814.7%
[
1.5%
-
2.0%
]
1.69%
1,286,7795.9%
[
1.5%
-
2.0%
]
1.90%
822,0386.3%
[
2.0%
-
2.5%
]
2.04%
778,4074.5%
[
2.0%
-
2.5%
]
2.22%
779,4637.5%
[
2.0%
-
2.5%
]
2.43%
609,1966.8%
[
2.5%
-
3.0%
]
2.59%
317,2545.8%
[
2.5%
-
3.0%
]
2.79%
196,4215.4%
[
2.5%
-
3.0%
]
2.95%
295,9706.2%
[
3.0%
-
3.5%
]
3.14%
209,8854.5%
[
3.0%
-
3.5%
]
3.32%
194,1735.5%
[
3.0%
-
3.5%
]
3.50%
184,9436.2%
[
3.5%
-
4.0%
]
3.69%
135,5202.3%
[
3.5%
-
4.0%
]
3.86%
79,1494.3%
[
3.5%
-
4.0%
]
3.98%
182,4856.9%
[
4.0%
-
4.5%
]
4.18%
205,7863.6%
[
4.0%
-
4.5%
]
4.41%
68,5994.8%
[
4.5%
-
5.0%
]
4.50%
92,0984.9%
[
4.5%
-
5.0%
]
4.79%
92,12410.3%
[
4.5%
-
5.0%
]
4.88%
181,3294.8%
[
5.0%
-
5.5%
]
5.31%
33,6431.7%
[
5.0%
-
5.5%
]
5.44%
83,5206.4%
[
5.5%
-
6.0%
]
5.60%
110,0995.6%
[
5.5%
-
6.0%
]
5.82%
69,7313.0%
[
5.5%
-
6.0%
]
5.95%
70,1979.7%
[
6.0%
-
6.5%
]
6.15%
26,1412.1%
[
6.0%
-
6.5%
]
6.37%
8,2056.2%
[
6.5%
-
7.0%
]
6.51%
123,1358.2%
[
6.5%
-
7.0%
]
6.75%
46,8226.4%
[
7.0%
-
7.5%
]
7.10%
3109.2%
[
7.0%
-
7.5%
]
7.41%
52616.7%
[
7.5%
-
8.0%
]
7.56%
55,87617.3%
[
7.5%
-
8.0%
]
7.95%
5287.3%
[
8.5%
-
9.0%
]
8.88%
116,3046.7%
[
9.5%
-
10.0%
]
9.54%
12,04812.9%
[
10.5%
-
11.0%
]
10.78%
1,2529.3%
[
10.5%
-
11.0%
]
10.97%
1,0304.3%
[
14.0%
-
14.5%
]
14.44%
2,3486.5%
[
15.5%
-
16.0%
]
15.99%
3,9147.8%
[
18.5%
-
19.0%
]
18.91%
5,3311.4%