Nigerian Receiving Food Stamps
COMPARE
Nigerian
Select to Compare
Receiving Food Stamps
Nigerian Receiving Food Stamps
13.1%
PUBLIC INCOME | FOOD STAMPS
3.5/ 100
METRIC RATING
227th/ 347
METRIC RANK
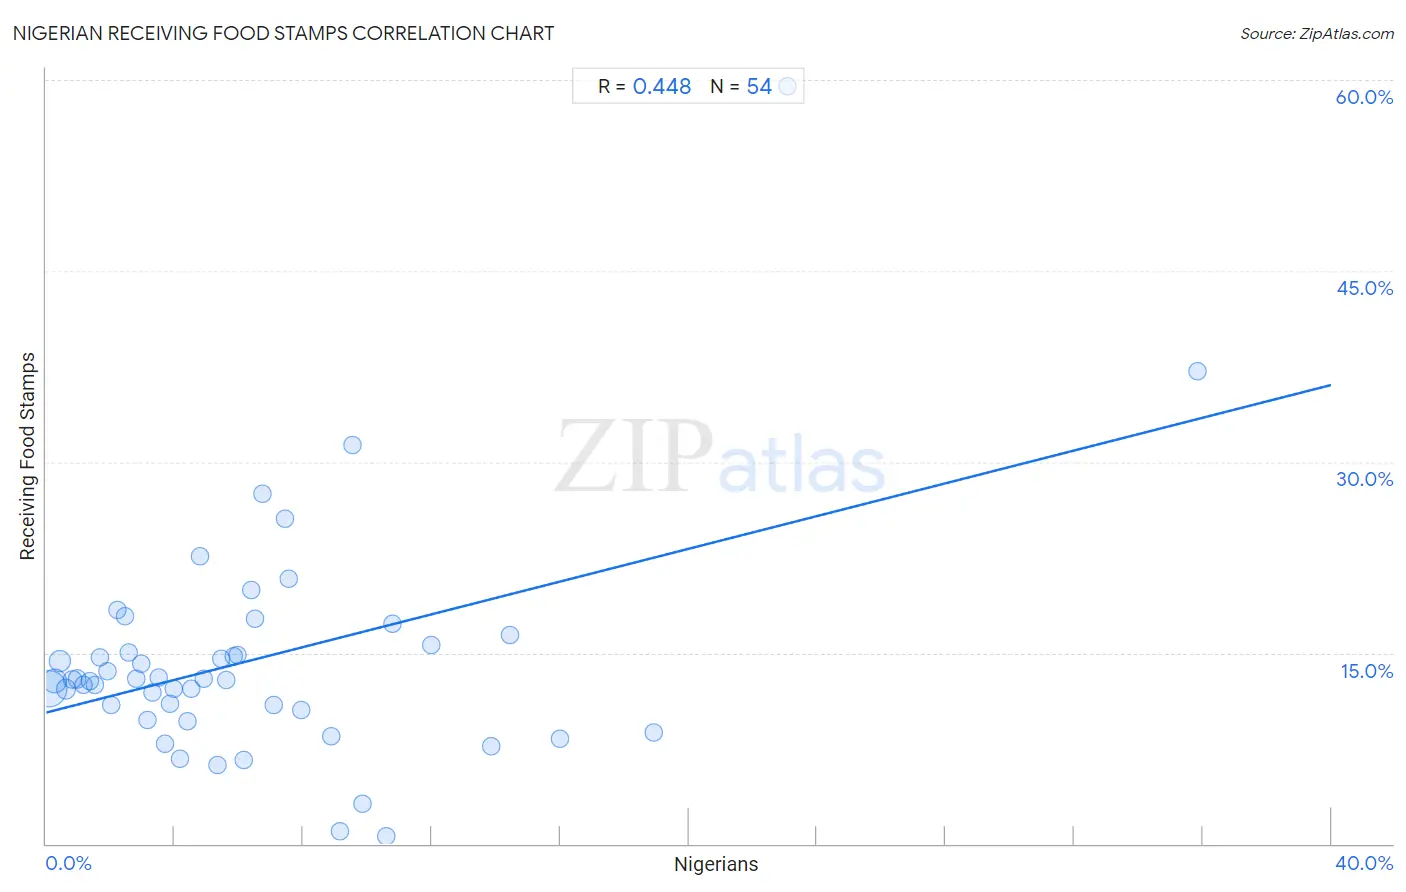
Nigerian Receiving Food Stamps Correlation Chart
The statistical analysis conducted on geographies consisting of 332,095,835 people shows a moderate positive correlation between the proportion of Nigerians and percentage of population receiving government assistance and/or food stamps in the United States with a correlation coefficient (R) of 0.448 and weighted average of 13.1%. On average, for every 1% (one percent) increase in Nigerians within a typical geography, there is an increase of 0.64% in percentage of population receiving government assistance and/or food stamps.
It is essential to understand that the correlation between the percentage of Nigerians and percentage of population receiving government assistance and/or food stamps does not imply a direct cause-and-effect relationship. It remains uncertain whether the presence of Nigerians influences an upward or downward trend in the level of percentage of population receiving government assistance and/or food stamps within an area, or if Nigerians simply ended up residing in those areas with higher or lower levels of percentage of population receiving government assistance and/or food stamps due to other factors.
Demographics Similar to Nigerians by Receiving Food Stamps
In terms of receiving food stamps, the demographic groups most similar to Nigerians are Panamanian (13.1%, a difference of 0.010%), Ottawa (13.1%, a difference of 0.020%), Chickasaw (13.1%, a difference of 0.050%), Puget Sound Salish (13.1%, a difference of 0.070%), and Immigrants from Nigeria (13.1%, a difference of 0.11%).
| Demographics | Rating | Rank | Receiving Food Stamps |
| Immigrants from Colombia | 5.3 /100 | #220 | Tragic 12.9% |
| Bermudans | 4.8 /100 | #221 | Tragic 13.0% |
| Immigrants | 4.4 /100 | #222 | Tragic 13.0% |
| Immigrants from Albania | 4.4 /100 | #223 | Tragic 13.0% |
| Immigrants from Armenia | 4.3 /100 | #224 | Tragic 13.0% |
| Fijians | 4.3 /100 | #225 | Tragic 13.0% |
| Chickasaw | 3.6 /100 | #226 | Tragic 13.1% |
| Nigerians | 3.5 /100 | #227 | Tragic 13.1% |
| Panamanians | 3.5 /100 | #228 | Tragic 13.1% |
| Ottawa | 3.5 /100 | #229 | Tragic 13.1% |
| Puget Sound Salish | 3.4 /100 | #230 | Tragic 13.1% |
| Immigrants from Nigeria | 3.4 /100 | #231 | Tragic 13.1% |
| Salvadorans | 2.7 /100 | #232 | Tragic 13.2% |
| Cherokee | 2.5 /100 | #233 | Tragic 13.2% |
| Comanche | 2.4 /100 | #234 | Tragic 13.3% |
Nigerian Receiving Food Stamps Correlation Summary
| Measurement | Nigerian Data | Receiving Food Stamps Data |
| Minimum | 0.080% | 0.60% |
| Maximum | 35.8% | 59.5% |
| Range | 35.7% | 58.9% |
| Mean | 6.4% | 14.4% |
| Median | 4.8% | 12.9% |
| Interquartile 25% (IQ1) | 2.4% | 10.5% |
| Interquartile 75% (IQ3) | 8.0% | 15.6% |
| Interquartile Range (IQR) | 5.5% | 5.1% |
| Standard Deviation (Sample) | 6.3% | 9.1% |
| Standard Deviation (Population) | 6.2% | 9.0% |
Correlation Details
| Nigerian Percentile | Sample Size | Receiving Food Stamps |
[ 0.0% - 0.5% ] 0.080% | 177,998,396 | 12.2% |
[ 0.0% - 0.5% ] 0.25% | 65,610,697 | 12.8% |
[ 0.0% - 0.5% ] 0.42% | 38,720,648 | 14.3% |
[ 0.5% - 1.0% ] 0.61% | 17,190,305 | 12.1% |
[ 0.5% - 1.0% ] 0.81% | 9,153,074 | 12.9% |
[ 0.5% - 1.0% ] 0.96% | 7,766,000 | 13.0% |
[ 1.0% - 1.5% ] 1.17% | 3,793,660 | 12.5% |
[ 1.0% - 1.5% ] 1.34% | 2,890,705 | 12.8% |
[ 1.5% - 2.0% ] 1.53% | 1,309,627 | 12.5% |
[ 1.5% - 2.0% ] 1.69% | 1,320,798 | 14.7% |
[ 1.5% - 2.0% ] 1.90% | 820,757 | 13.6% |
[ 2.0% - 2.5% ] 2.04% | 805,502 | 10.9% |
[ 2.0% - 2.5% ] 2.22% | 795,469 | 18.3% |
[ 2.0% - 2.5% ] 2.43% | 615,058 | 17.9% |
[ 2.5% - 3.0% ] 2.59% | 324,855 | 15.0% |
[ 2.5% - 3.0% ] 2.79% | 201,271 | 13.0% |
[ 2.5% - 3.0% ] 2.95% | 298,237 | 14.1% |
[ 3.0% - 3.5% ] 3.14% | 217,956 | 9.7% |
[ 3.0% - 3.5% ] 3.32% | 194,173 | 11.8% |
[ 3.0% - 3.5% ] 3.49% | 207,368 | 13.1% |
[ 3.5% - 4.0% ] 3.68% | 141,652 | 7.9% |
[ 3.5% - 4.0% ] 3.86% | 81,445 | 11.0% |
[ 3.5% - 4.0% ] 3.98% | 184,387 | 12.2% |
[ 4.0% - 4.5% ] 4.18% | 205,786 | 6.6% |
[ 4.0% - 4.5% ] 4.41% | 66,257 | 9.6% |
[ 4.5% - 5.0% ] 4.50% | 92,098 | 12.2% |
[ 4.5% - 5.0% ] 4.79% | 92,124 | 22.6% |
[ 4.5% - 5.0% ] 4.88% | 181,329 | 12.9% |
[ 5.0% - 5.5% ] 5.31% | 43,686 | 6.2% |
[ 5.0% - 5.5% ] 5.44% | 96,786 | 14.6% |
[ 5.5% - 6.0% ] 5.60% | 110,099 | 12.9% |
[ 5.5% - 6.0% ] 5.82% | 70,078 | 14.7% |
[ 5.5% - 6.0% ] 5.95% | 70,197 | 14.8% |
[ 6.0% - 6.5% ] 6.15% | 26,141 | 6.6% |
[ 6.0% - 6.5% ] 6.37% | 5,905 | 19.9% |
[ 6.5% - 7.0% ] 6.51% | 123,135 | 17.7% |
[ 6.5% - 7.0% ] 6.75% | 46,957 | 27.5% |
[ 7.0% - 7.5% ] 7.10% | 310 | 10.9% |
[ 7.0% - 7.5% ] 7.41% | 526 | 25.5% |
[ 7.5% - 8.0% ] 7.56% | 55,876 | 20.8% |
[ 7.5% - 8.0% ] 7.95% | 528 | 10.5% |
[ 8.5% - 9.0% ] 8.88% | 116,587 | 8.5% |
[ 9.0% - 9.5% ] 9.15% | 2,351 | 1.0% |
[ 9.5% - 10.0% ] 9.54% | 12,048 | 31.3% |
[ 9.5% - 10.0% ] 9.83% | 2,299 | 3.1% |
[ 10.5% - 11.0% ] 10.58% | 4,375 | 0.60% |
[ 10.5% - 11.0% ] 10.78% | 1,382 | 17.2% |
[ 12.0% - 12.5% ] 12.00% | 1,875 | 15.6% |
[ 13.5% - 14.0% ] 13.85% | 13,192 | 7.7% |
[ 14.0% - 14.5% ] 14.44% | 2,348 | 16.4% |
[ 15.5% - 16.0% ] 15.99% | 3,914 | 8.2% |
[ 18.5% - 19.0% ] 18.91% | 5,331 | 8.7% |
[ 23.0% - 23.5% ] 23.08% | 208 | 59.5% |
[ 35.5% - 36.0% ] 35.82% | 67 | 37.1% |