Nigerian GED/Equivalency

COMPARE

Nigerian
Race
Ancestry
AfghanAfricanAlaska NativeAlaskan AthabascanAlbanianAleutAlsatianAmericanApacheArabArapahoArgentineanArmenianAssyrian/Chaldean/SyriacAustralianAustrianBahamianBangladeshiBarbadianBasqueBelgianBelizeanBermudanBhutaneseBlackfeetBolivianBrazilianBritishBritish West IndianBulgarianBurmeseCajunCambodianCanadianCape VerdeanCarpatho RusynCelticCentral AmericanCentral American IndianCherokeeCheyenneChickasawChileanChineseChippewaChoctawColombianColvilleComancheCosta RicanCreeCreekCroatianCrowCubanCypriotCzechCzechoslovakianDanishDelawareDominicanDutchDutch West IndianEastern EuropeanEcuadorianEgyptianEnglishEstonianEthiopianEuropeanFijianFilipinoFinnishFrenchFrench American IndianFrench CanadianGermanGerman RussianGhanaianGreekGuamanian/ChamorroGuatemalanGuyaneseHaitianHmongHonduranHopiHoumaHungarianIcelanderIndian (Asian)IndonesianInupiatIranianIraqiIrishIroquoisIsraeliItalianJamaicanJapaneseJordanianKenyanKiowaKoreanLaotianLatvianLebaneseLiberianLithuanianLumbeeLuxembourgerMacedonianMalaysianMalteseMarshalleseMenomineeMexicanMexican American IndianMongolianMoroccanNative HawaiianNavajoNepaleseNew ZealanderNicaraguanNigerianNorthern EuropeanNorwegianOkinawanOsageOttawaPaiutePakistaniPalestinianPanamanianParaguayanPennsylvania GermanPeruvianPimaPolishPortuguesePotawatomiPuebloPuerto RicanPuget Sound SalishRomanianRussianSalvadoranSamoanScandinavianScotch-IrishScottishSeminoleSenegaleseSerbianShoshoneSierra LeoneanSiouxSlavicSlovakSloveneSomaliSouth AfricanSouth AmericanSouth American IndianSoviet UnionSpaniardSpanishSpanish AmericanSpanish American IndianSri LankanSubsaharan AfricanSudaneseSwedishSwissSyrianTaiwaneseThaiTlingit-HaidaTohono O'OdhamTonganTrinidadian and TobagonianTsimshianTurkishU.S. Virgin IslanderUgandanUkrainianUruguayanUteVenezuelanVietnameseWelshWest IndianYakamaYaquiYugoslavianYumanYup'ikZimbabwean
Immigration
NonimmigrantsImmigrantsAfghanistanAfricaAlbaniaArgentinaArmeniaAsiaAustraliaAustriaBahamasBangladeshBarbadosBelarusBelgiumBelizeBoliviaBosnia and HerzegovinaBrazilBulgariaBurma/MyanmarCabo VerdeCambodiaCameroonCanadaCaribbeanCentral AmericaChileChinaColombiaCongoCosta RicaCroatiaCubaCzechoslovakiaDenmarkDominicaDominican RepublicEastern AfricaEastern AsiaEastern EuropeEcuadorEgyptEl SalvadorEnglandEritreaEthiopiaEuropeFijiFranceGermanyGhanaGreeceGrenadaGuatemalaGuyanaHaitiHondurasHong KongHungaryIndiaIndonesiaIranIraqIrelandIsraelItalyJamaicaJapanJordanKazakhstanKenyaKoreaKuwaitLaosLatin AmericaLatviaLebanonLiberiaLithuaniaMalaysiaMexicoMicronesiaMiddle AfricaMoldovaMoroccoNepalNetherlandsNicaraguaNigeriaNorth AmericaNorth MacedoniaNorthern AfricaNorthern EuropeNorwayOceaniaPakistanPanamaPeruPhilippinesPolandPortugalRomaniaRussiaSaudi ArabiaScotlandSenegalSerbiaSierra LeoneSingaporeSomaliaSouth AfricaSouth AmericaSouth Central AsiaSouth Eastern AsiaSouthern EuropeSpainSri LankaSt. Vincent and the GrenadinesSudanSwedenSwitzerlandSyriaTaiwanThailandTrinidad and TobagoTurkeyUgandaUkraineUruguayUzbekistanVenezuelaVietnamWest IndiesWestern AfricaWestern AsiaWestern EuropeYemenZaireZimbabweAzores
Select to Compare
Race
Ancestry
AfghanAfricanAlaska NativeAlaskan AthabascanAlbanianAleutAlsatianAmericanApacheArabArapahoArgentineanArmenianAssyrian/Chaldean/SyriacAustralianAustrianBahamianBangladeshiBarbadianBasqueBelgianBelizeanBermudanBhutaneseBlackfeetBolivianBrazilianBritishBritish West IndianBulgarianBurmeseCajunCambodianCanadianCape VerdeanCarpatho RusynCelticCentral AmericanCentral American IndianCherokeeCheyenneChickasawChileanChineseChippewaChoctawColombianColvilleComancheCosta RicanCreeCreekCroatianCrowCubanCypriotCzechCzechoslovakianDanishDelawareDominicanDutchDutch West IndianEastern EuropeanEcuadorianEgyptianEnglishEstonianEthiopianEuropeanFijianFilipinoFinnishFrenchFrench American IndianFrench CanadianGermanGerman RussianGhanaianGreekGuamanian/ChamorroGuatemalanGuyaneseHaitianHmongHonduranHopiHoumaHungarianIcelanderIndian (Asian)IndonesianInupiatIranianIraqiIrishIroquoisIsraeliItalianJamaicanJapaneseJordanianKenyanKiowaKoreanLaotianLatvianLebaneseLiberianLithuanianLumbeeLuxembourgerMacedonianMalaysianMalteseMarshalleseMenomineeMexicanMexican American IndianMongolianMoroccanNative HawaiianNavajoNepaleseNew ZealanderNicaraguanNorthern EuropeanNorwegianOkinawanOsageOttawaPaiutePakistaniPalestinianPanamanianParaguayanPennsylvania GermanPeruvianPimaPolishPortuguesePotawatomiPuebloPuerto RicanPuget Sound SalishRomanianRussianSalvadoranSamoanScandinavianScotch-IrishScottishSeminoleSenegaleseSerbianShoshoneSierra LeoneanSiouxSlavicSlovakSloveneSomaliSouth AfricanSouth AmericanSouth American IndianSoviet UnionSpaniardSpanishSpanish AmericanSpanish American IndianSri LankanSubsaharan AfricanSudaneseSwedishSwissSyrianTaiwaneseThaiTlingit-HaidaTohono O'OdhamTonganTrinidadian and TobagonianTsimshianTurkishU.S. Virgin IslanderUgandanUkrainianUruguayanUteVenezuelanVietnameseWelshWest IndianYakamaYaquiYugoslavianYumanYup'ikZimbabwean
Immigration
NonimmigrantsImmigrantsAfghanistanAfricaAlbaniaArgentinaArmeniaAsiaAustraliaAustriaBahamasBangladeshBarbadosBelarusBelgiumBelizeBoliviaBosnia and HerzegovinaBrazilBulgariaBurma/MyanmarCabo VerdeCambodiaCameroonCanadaCaribbeanCentral AmericaChileChinaColombiaCongoCosta RicaCroatiaCubaCzechoslovakiaDenmarkDominicaDominican RepublicEastern AfricaEastern AsiaEastern EuropeEcuadorEgyptEl SalvadorEnglandEritreaEthiopiaEuropeFijiFranceGermanyGhanaGreeceGrenadaGuatemalaGuyanaHaitiHondurasHong KongHungaryIndiaIndonesiaIranIraqIrelandIsraelItalyJamaicaJapanJordanKazakhstanKenyaKoreaKuwaitLaosLatin AmericaLatviaLebanonLiberiaLithuaniaMalaysiaMexicoMicronesiaMiddle AfricaMoldovaMoroccoNepalNetherlandsNicaraguaNigeriaNorth AmericaNorth MacedoniaNorthern AfricaNorthern EuropeNorwayOceaniaPakistanPanamaPeruPhilippinesPolandPortugalRomaniaRussiaSaudi ArabiaScotlandSenegalSerbiaSierra LeoneSingaporeSomaliaSouth AfricaSouth AmericaSouth Central AsiaSouth Eastern AsiaSouthern EuropeSpainSri LankaSt. Vincent and the GrenadinesSudanSwedenSwitzerlandSyriaTaiwanThailandTrinidad and TobagoTurkeyUgandaUkraineUruguayUzbekistanVenezuelaVietnamWest IndiesWestern AfricaWestern AsiaWestern EuropeYemenZaireZimbabweAzores
GED/Equivalency
Income
Poverty
Unemployment
Labor Participation
Family Structure
Vehicle Availability
Education Level
Disability

Nigerian GED/Equivalency
Tragic

84.7%
GED/EQUIVALENCY
8.6/ 100
METRIC RATING
217th/ 347
METRIC RANK

Nigerian GED/Equivalency Correlation Chart

The statistical analysis conducted on geographies consisting of 332,724,627 people shows a moderate positive correlation between the proportion of Nigerians and percentage of population with at least ged/equivalency education in the United States with a correlation coefficient (R) of 0.450 and weighted average of 84.7%. On average, for every 1% (one percent) increase in Nigerians within a typical geography, there is an increase of 0.39% in percentage of population with at least ged/equivalency education.
Nigerian GED/Equivalency
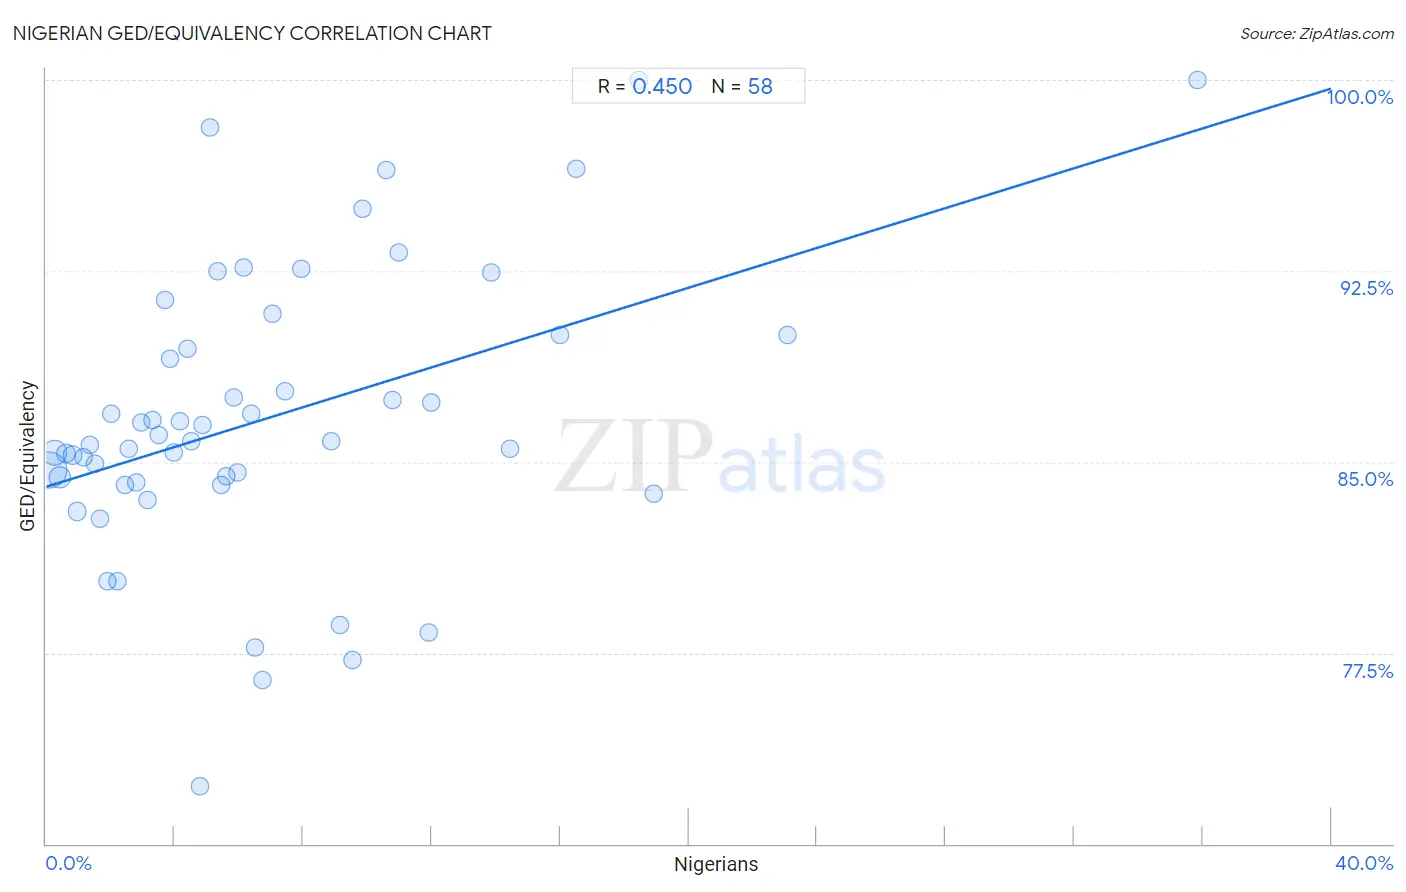
It is essential to understand that the correlation between the percentage of Nigerians and percentage of population with at least ged/equivalency education does not imply a direct cause-and-effect relationship. It remains uncertain whether the presence of Nigerians influences an upward or downward trend in the level of percentage of population with at least ged/equivalency education within an area, or if Nigerians simply ended up residing in those areas with higher or lower levels of percentage of population with at least ged/equivalency education due to other factors.

Demographics Similar to Nigerians by GED/Equivalency

In terms of ged/equivalency, the demographic groups most similar to Nigerians are Immigrants from Micronesia (84.7%, a difference of 0.0%), Alaska Native (84.7%, a difference of 0.0%), Peruvian (84.7%, a difference of 0.030%), Potawatomi (84.7%, a difference of 0.030%), and American (84.7%, a difference of 0.030%).
DemographicsRating | RankGED/Equivalency
Immigrants from Cameroon
12.1
/100
|
#210
Poor
84.9%
South Americans
10.9
/100
|
#211
Poor
84.8%
Immigrants from Somalia
10.6
/100
|
#212
Poor
84.8%
Immigrants from Philippines
10.0
/100
|
#213
Poor
84.8%
Osage
9.5
/100
|
#214
Tragic
84.8%
Peruvians
9.2
/100
|
#215
Tragic
84.7%
Immigrants from Micronesia
8.7
/100
|
#216
Tragic
84.7%
Nigerians
8.6
/100
|
#217
Tragic
84.7%
Alaska Natives
8.6
/100
|
#218
Tragic
84.7%
Potawatomi
8.2
/100
|
#219
Tragic
84.7%
Americans
8.2
/100
|
#220
Tragic
84.7%
Taiwanese
8.1
/100
|
#221
Tragic
84.7%
Iroquois
7.5
/100
|
#222
Tragic
84.6%
Immigrants from Uzbekistan
7.1
/100
|
#223
Tragic
84.6%
French American Indians
6.3
/100
|
#224
Tragic
84.6%

Nigerian GED/Equivalency Correlation Summary

MeasurementNigerian DataGED/Equivalency Data
Minimum0.080%72.2%
Maximum35.8%100.0%
Range35.7%27.8%
Mean6.9%86.7%
Median5.2%85.8%
Interquartile 25% (IQ1)2.6%84.2%
Interquartile 75% (IQ3)9.5%90.0%
Interquartile Range (IQR)7.0%5.8%
Standard Deviation (Sample)6.5%5.6%
Standard Deviation (Population)6.4%5.6%

Correlation Details

Nigerian PercentileSample SizeGED/Equivalency
[
0.0%
-
0.5%
]
0.080%
178,273,86784.7%
[
0.0%
-
0.5%
]
0.25%
65,735,02985.4%
[
0.0%
-
0.5%
]
0.42%
38,816,74784.4%
[
0.5%
-
1.0%
]
0.61%
17,230,22085.3%
[
0.5%
-
1.0%
]
0.81%
9,203,03785.3%
[
0.5%
-
1.0%
]
0.96%
7,784,30083.1%
[
1.0%
-
1.5%
]
1.17%
3,809,48185.2%
[
1.0%
-
1.5%
]
1.34%
2,893,30885.7%
[
1.5%
-
2.0%
]
1.53%
1,314,75384.9%
[
1.5%
-
2.0%
]
1.69%
1,324,55982.8%
[
1.5%
-
2.0%
]
1.90%
830,17180.3%
[
2.0%
-
2.5%
]
2.04%
811,14686.9%
[
2.0%
-
2.5%
]
2.22%
802,07980.3%
[
2.0%
-
2.5%
]
2.43%
615,81684.1%
[
2.5%
-
3.0%
]
2.59%
328,63085.5%
[
2.5%
-
3.0%
]
2.79%
201,51784.2%
[
2.5%
-
3.0%
]
2.95%
299,07686.5%
[
3.0%
-
3.5%
]
3.14%
220,51783.5%
[
3.0%
-
3.5%
]
3.32%
194,17386.7%
[
3.0%
-
3.5%
]
3.49%
207,48086.0%
[
3.5%
-
4.0%
]
3.68%
141,65291.4%
[
3.5%
-
4.0%
]
3.86%
81,44589.0%
[
3.5%
-
4.0%
]
3.98%
188,55185.4%
[
4.0%
-
4.5%
]
4.18%
205,78686.6%
[
4.0%
-
4.5%
]
4.41%
68,59989.4%
[
4.5%
-
5.0%
]
4.51%
96,40885.8%
[
4.5%
-
5.0%
]
4.79%
92,12472.2%
[
4.5%
-
5.0%
]
4.88%
182,48286.4%
[
5.0%
-
5.5%
]
5.08%
1,57598.1%
[
5.0%
-
5.5%
]
5.31%
43,68692.5%
[
5.0%
-
5.5%
]
5.44%
97,10084.1%
[
5.5%
-
6.0%
]
5.60%
112,27684.4%
[
5.5%
-
6.0%
]
5.82%
70,07887.6%
[
5.5%
-
6.0%
]
5.95%
70,19784.6%
[
6.0%
-
6.5%
]
6.15%
26,14192.6%
[
6.0%
-
6.5%
]
6.37%
8,20586.9%
[
6.5%
-
7.0%
]
6.51%
123,13577.7%
[
6.5%
-
7.0%
]
6.75%
47,96776.4%
[
7.0%
-
7.5%
]
7.06%
1,31790.8%
[
7.0%
-
7.5%
]
7.42%
82287.8%
[
7.5%
-
8.0%
]
7.95%
66792.6%
[
8.5%
-
9.0%
]
8.88%
116,58785.8%
[
9.0%
-
9.5%
]
9.15%
2,35178.6%
[
9.5%
-
10.0%
]
9.54%
12,48777.2%
[
9.5%
-
10.0%
]
9.83%
2,29994.9%
[
10.5%
-
11.0%
]
10.58%
4,37596.4%
[
10.5%
-
11.0%
]
10.78%
1,38287.4%
[
10.5%
-
11.0%
]
10.97%
1,03093.2%
[
11.5%
-
12.0%
]
11.89%
14378.3%
[
12.0%
-
12.5%
]
12.00%
1,87587.3%
[
13.5%
-
14.0%
]
13.85%
13,19292.4%
[
14.0%
-
14.5%
]
14.44%
2,34885.5%
[
15.5%
-
16.0%
]
15.99%
3,91490.0%
[
16.0%
-
16.5%
]
16.48%
18296.5%
[
18.0%
-
18.5%
]
18.45%
737100.0%
[
18.5%
-
19.0%
]
18.91%
5,33183.8%
[
23.0%
-
23.5%
]
23.08%
20890.0%
[
35.5%
-
36.0%
]
35.82%
67100.0%