Nigerian Self-Care Disability

COMPARE

Nigerian
Race
Ancestry
AfghanAfricanAlaska NativeAlaskan AthabascanAlbanianAleutAlsatianAmericanApacheArabArapahoArgentineanArmenianAssyrian/Chaldean/SyriacAustralianAustrianBahamianBangladeshiBarbadianBasqueBelgianBelizeanBermudanBhutaneseBlackfeetBolivianBrazilianBritishBritish West IndianBulgarianBurmeseCajunCambodianCanadianCape VerdeanCarpatho RusynCelticCentral AmericanCentral American IndianCherokeeCheyenneChickasawChileanChineseChippewaChoctawColombianColvilleComancheCosta RicanCreeCreekCroatianCrowCubanCypriotCzechCzechoslovakianDanishDelawareDominicanDutchDutch West IndianEastern EuropeanEcuadorianEgyptianEnglishEstonianEthiopianEuropeanFijianFilipinoFinnishFrenchFrench American IndianFrench CanadianGermanGerman RussianGhanaianGreekGuamanian/ChamorroGuatemalanGuyaneseHaitianHmongHonduranHopiHoumaHungarianIcelanderIndian (Asian)IndonesianInupiatIranianIraqiIrishIroquoisIsraeliItalianJamaicanJapaneseJordanianKenyanKiowaKoreanLaotianLatvianLebaneseLiberianLithuanianLumbeeLuxembourgerMacedonianMalaysianMalteseMarshalleseMenomineeMexicanMexican American IndianMongolianMoroccanNative HawaiianNavajoNepaleseNew ZealanderNicaraguanNigerianNorthern EuropeanNorwegianOkinawanOsageOttawaPaiutePakistaniPalestinianPanamanianParaguayanPennsylvania GermanPeruvianPimaPolishPortuguesePotawatomiPuebloPuerto RicanPuget Sound SalishRomanianRussianSalvadoranSamoanScandinavianScotch-IrishScottishSeminoleSenegaleseSerbianShoshoneSierra LeoneanSiouxSlavicSlovakSloveneSomaliSouth AfricanSouth AmericanSouth American IndianSoviet UnionSpaniardSpanishSpanish AmericanSpanish American IndianSri LankanSubsaharan AfricanSudaneseSwedishSwissSyrianTaiwaneseThaiTlingit-HaidaTohono O'OdhamTonganTrinidadian and TobagonianTsimshianTurkishU.S. Virgin IslanderUgandanUkrainianUruguayanUteVenezuelanVietnameseWelshWest IndianYakamaYaquiYugoslavianYumanYup'ikZimbabwean
Immigration
NonimmigrantsImmigrantsAfghanistanAfricaAlbaniaArgentinaArmeniaAsiaAustraliaAustriaBahamasBangladeshBarbadosBelarusBelgiumBelizeBoliviaBosnia and HerzegovinaBrazilBulgariaBurma/MyanmarCabo VerdeCambodiaCameroonCanadaCaribbeanCentral AmericaChileChinaColombiaCongoCosta RicaCroatiaCubaCzechoslovakiaDenmarkDominicaDominican RepublicEastern AfricaEastern AsiaEastern EuropeEcuadorEgyptEl SalvadorEnglandEritreaEthiopiaEuropeFijiFranceGermanyGhanaGreeceGrenadaGuatemalaGuyanaHaitiHondurasHong KongHungaryIndiaIndonesiaIranIraqIrelandIsraelItalyJamaicaJapanJordanKazakhstanKenyaKoreaKuwaitLaosLatin AmericaLatviaLebanonLiberiaLithuaniaMalaysiaMexicoMicronesiaMiddle AfricaMoldovaMoroccoNepalNetherlandsNicaraguaNigeriaNorth AmericaNorth MacedoniaNorthern AfricaNorthern EuropeNorwayOceaniaPakistanPanamaPeruPhilippinesPolandPortugalRomaniaRussiaSaudi ArabiaScotlandSenegalSerbiaSierra LeoneSingaporeSomaliaSouth AfricaSouth AmericaSouth Central AsiaSouth Eastern AsiaSouthern EuropeSpainSri LankaSt. Vincent and the GrenadinesSudanSwedenSwitzerlandSyriaTaiwanThailandTrinidad and TobagoTurkeyUgandaUkraineUruguayUzbekistanVenezuelaVietnamWest IndiesWestern AfricaWestern AsiaWestern EuropeYemenZaireZimbabweAzores
Select to Compare
Race
Ancestry
AfghanAfricanAlaska NativeAlaskan AthabascanAlbanianAleutAlsatianAmericanApacheArabArapahoArgentineanArmenianAssyrian/Chaldean/SyriacAustralianAustrianBahamianBangladeshiBarbadianBasqueBelgianBelizeanBermudanBhutaneseBlackfeetBolivianBrazilianBritishBritish West IndianBulgarianBurmeseCajunCambodianCanadianCape VerdeanCarpatho RusynCelticCentral AmericanCentral American IndianCherokeeCheyenneChickasawChileanChineseChippewaChoctawColombianColvilleComancheCosta RicanCreeCreekCroatianCrowCubanCypriotCzechCzechoslovakianDanishDelawareDominicanDutchDutch West IndianEastern EuropeanEcuadorianEgyptianEnglishEstonianEthiopianEuropeanFijianFilipinoFinnishFrenchFrench American IndianFrench CanadianGermanGerman RussianGhanaianGreekGuamanian/ChamorroGuatemalanGuyaneseHaitianHmongHonduranHopiHoumaHungarianIcelanderIndian (Asian)IndonesianInupiatIranianIraqiIrishIroquoisIsraeliItalianJamaicanJapaneseJordanianKenyanKiowaKoreanLaotianLatvianLebaneseLiberianLithuanianLumbeeLuxembourgerMacedonianMalaysianMalteseMarshalleseMenomineeMexicanMexican American IndianMongolianMoroccanNative HawaiianNavajoNepaleseNew ZealanderNicaraguanNorthern EuropeanNorwegianOkinawanOsageOttawaPaiutePakistaniPalestinianPanamanianParaguayanPennsylvania GermanPeruvianPimaPolishPortuguesePotawatomiPuebloPuerto RicanPuget Sound SalishRomanianRussianSalvadoranSamoanScandinavianScotch-IrishScottishSeminoleSenegaleseSerbianShoshoneSierra LeoneanSiouxSlavicSlovakSloveneSomaliSouth AfricanSouth AmericanSouth American IndianSoviet UnionSpaniardSpanishSpanish AmericanSpanish American IndianSri LankanSubsaharan AfricanSudaneseSwedishSwissSyrianTaiwaneseThaiTlingit-HaidaTohono O'OdhamTonganTrinidadian and TobagonianTsimshianTurkishU.S. Virgin IslanderUgandanUkrainianUruguayanUteVenezuelanVietnameseWelshWest IndianYakamaYaquiYugoslavianYumanYup'ikZimbabwean
Immigration
NonimmigrantsImmigrantsAfghanistanAfricaAlbaniaArgentinaArmeniaAsiaAustraliaAustriaBahamasBangladeshBarbadosBelarusBelgiumBelizeBoliviaBosnia and HerzegovinaBrazilBulgariaBurma/MyanmarCabo VerdeCambodiaCameroonCanadaCaribbeanCentral AmericaChileChinaColombiaCongoCosta RicaCroatiaCubaCzechoslovakiaDenmarkDominicaDominican RepublicEastern AfricaEastern AsiaEastern EuropeEcuadorEgyptEl SalvadorEnglandEritreaEthiopiaEuropeFijiFranceGermanyGhanaGreeceGrenadaGuatemalaGuyanaHaitiHondurasHong KongHungaryIndiaIndonesiaIranIraqIrelandIsraelItalyJamaicaJapanJordanKazakhstanKenyaKoreaKuwaitLaosLatin AmericaLatviaLebanonLiberiaLithuaniaMalaysiaMexicoMicronesiaMiddle AfricaMoldovaMoroccoNepalNetherlandsNicaraguaNigeriaNorth AmericaNorth MacedoniaNorthern AfricaNorthern EuropeNorwayOceaniaPakistanPanamaPeruPhilippinesPolandPortugalRomaniaRussiaSaudi ArabiaScotlandSenegalSerbiaSierra LeoneSingaporeSomaliaSouth AfricaSouth AmericaSouth Central AsiaSouth Eastern AsiaSouthern EuropeSpainSri LankaSt. Vincent and the GrenadinesSudanSwedenSwitzerlandSyriaTaiwanThailandTrinidad and TobagoTurkeyUgandaUkraineUruguayUzbekistanVenezuelaVietnamWest IndiesWestern AfricaWestern AsiaWestern EuropeYemenZaireZimbabweAzores
Self-Care Disability
Income
Poverty
Unemployment
Labor Participation
Family Structure
Vehicle Availability
Education Level
Disability

Nigerian Self-Care Disability
Good

2.4%
SELF-CARE DISABILITY
70.6/ 100
METRIC RATING
156th/ 347
METRIC RANK

Nigerian Self-Care Disability Correlation Chart

The statistical analysis conducted on geographies consisting of 332,359,271 people shows a mild positive correlation between the proportion of Nigerians and percentage of population with self-care disability in the United States with a correlation coefficient (R) of 0.300 and weighted average of 2.4%. On average, for every 1% (one percent) increase in Nigerians within a typical geography, there is an increase of 0.13% in percentage of population with self-care disability.
Nigerian Self-Care Disability
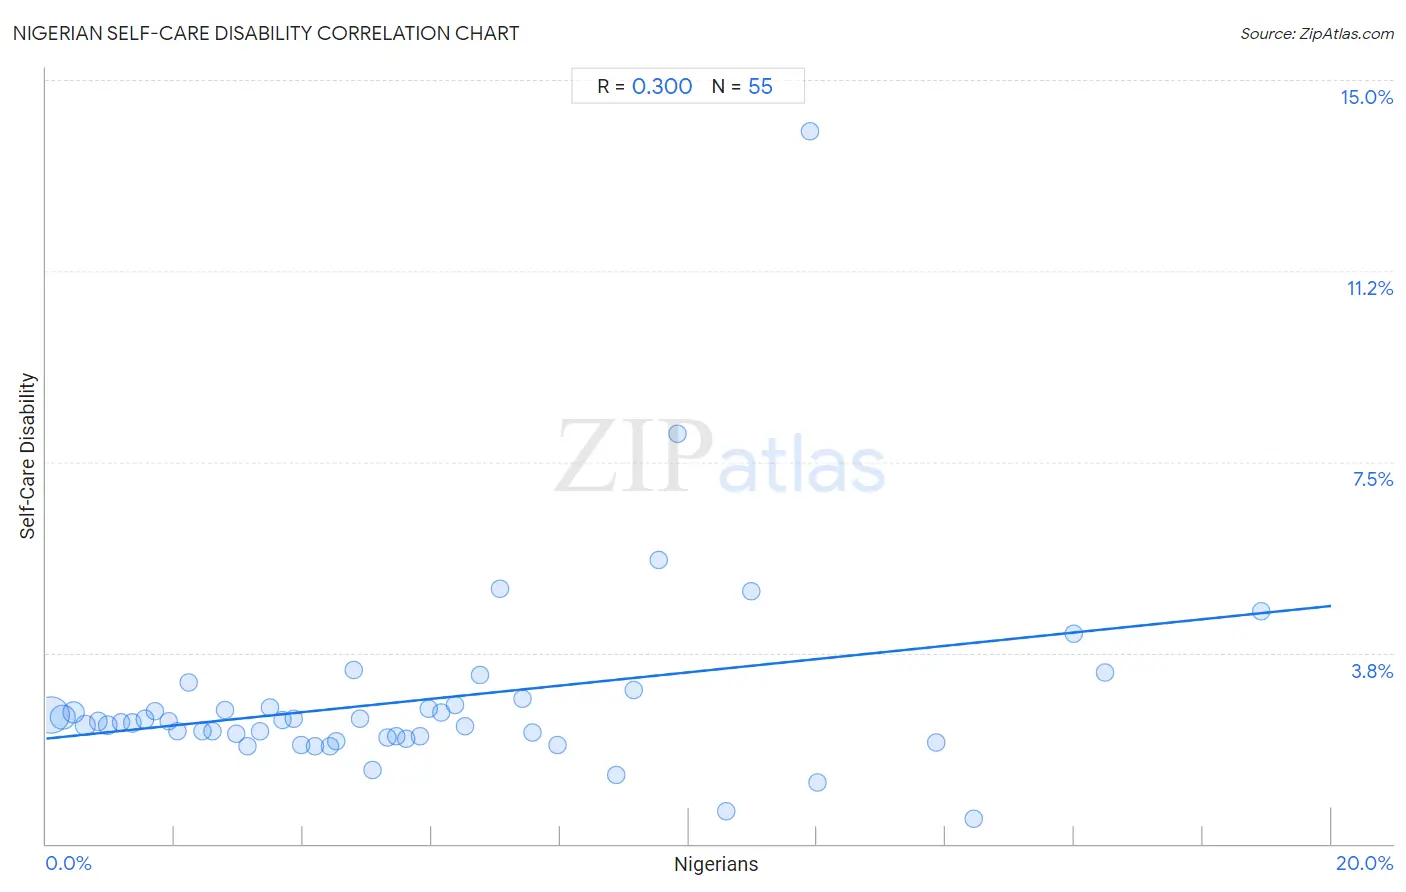
It is essential to understand that the correlation between the percentage of Nigerians and percentage of population with self-care disability does not imply a direct cause-and-effect relationship. It remains uncertain whether the presence of Nigerians influences an upward or downward trend in the level of percentage of population with self-care disability within an area, or if Nigerians simply ended up residing in those areas with higher or lower levels of percentage of population with self-care disability due to other factors.

Demographics Similar to Nigerians by Self-Care Disability

In terms of self-care disability, the demographic groups most similar to Nigerians are Pakistani (2.4%, a difference of 0.050%), Immigrants from Europe (2.4%, a difference of 0.060%), Italian (2.4%, a difference of 0.090%), Immigrants from Western Europe (2.4%, a difference of 0.12%), and Immigrants from Italy (2.4%, a difference of 0.12%).
DemographicsRating | RankSelf-Care Disability
Arabs
75.7
/100
|
#149
Good
2.4%
Immigrants from Costa Rica
75.1
/100
|
#150
Good
2.4%
Basques
74.0
/100
|
#151
Good
2.4%
Tlingit-Haida
73.5
/100
|
#152
Good
2.4%
Immigrants from England
73.5
/100
|
#153
Good
2.4%
Italians
72.2
/100
|
#154
Good
2.4%
Pakistanis
71.4
/100
|
#155
Good
2.4%
Nigerians
70.6
/100
|
#156
Good
2.4%
Immigrants from Europe
69.6
/100
|
#157
Good
2.4%
Immigrants from Western Europe
68.6
/100
|
#158
Good
2.4%
Immigrants from Italy
68.5
/100
|
#159
Good
2.4%
Finns
67.0
/100
|
#160
Good
2.4%
Lebanese
66.5
/100
|
#161
Good
2.4%
Somalis
63.7
/100
|
#162
Good
2.5%
German Russians
62.7
/100
|
#163
Good
2.5%

Nigerian Self-Care Disability Correlation Summary

MeasurementNigerian DataSelf-Care Disability Data
Minimum0.080%0.50%
Maximum18.9%14.0%
Range18.8%13.5%
Mean5.8%2.8%
Median4.9%2.4%
Interquartile 25% (IQ1)2.4%2.1%
Interquartile 75% (IQ3)8.0%2.7%
Interquartile Range (IQR)5.5%0.62%
Standard Deviation (Sample)4.5%1.9%
Standard Deviation (Population)4.4%1.9%

Correlation Details

Nigerian PercentileSample SizeSelf-Care Disability
[
0.0%
-
0.5%
]
0.080%
178,162,7472.5%
[
0.0%
-
0.5%
]
0.25%
65,645,7722.5%
[
0.0%
-
0.5%
]
0.42%
38,754,5412.6%
[
0.5%
-
1.0%
]
0.61%
17,180,1322.3%
[
0.5%
-
1.0%
]
0.81%
9,168,2282.4%
[
0.5%
-
1.0%
]
0.96%
7,771,0212.3%
[
1.0%
-
1.5%
]
1.17%
3,796,3802.4%
[
1.0%
-
1.5%
]
1.34%
2,890,7052.4%
[
1.5%
-
2.0%
]
1.53%
1,310,2972.4%
[
1.5%
-
2.0%
]
1.69%
1,320,2632.6%
[
1.5%
-
2.0%
]
1.90%
827,1582.4%
[
2.0%
-
2.5%
]
2.04%
810,1072.2%
[
2.0%
-
2.5%
]
2.22%
793,2803.2%
[
2.0%
-
2.5%
]
2.43%
613,4682.2%
[
2.5%
-
3.0%
]
2.59%
324,8552.2%
[
2.5%
-
3.0%
]
2.79%
201,0112.6%
[
2.5%
-
3.0%
]
2.95%
299,0762.2%
[
3.0%
-
3.5%
]
3.14%
220,5171.9%
[
3.0%
-
3.5%
]
3.32%
194,1732.2%
[
3.0%
-
3.5%
]
3.49%
207,4802.7%
[
3.5%
-
4.0%
]
3.68%
141,6522.4%
[
3.5%
-
4.0%
]
3.86%
80,5962.5%
[
3.5%
-
4.0%
]
3.98%
184,3871.9%
[
4.0%
-
4.5%
]
4.18%
205,7861.9%
[
4.0%
-
4.5%
]
4.41%
68,5991.9%
[
4.5%
-
5.0%
]
4.51%
96,4082.0%
[
4.5%
-
5.0%
]
4.79%
92,1243.4%
[
4.5%
-
5.0%
]
4.88%
181,3292.4%
[
5.0%
-
5.5%
]
5.08%
1,5751.5%
[
5.0%
-
5.5%
]
5.31%
43,6862.1%
[
5.0%
-
5.5%
]
5.44%
96,7862.1%
[
5.5%
-
6.0%
]
5.60%
110,0992.1%
[
5.5%
-
6.0%
]
5.82%
70,0782.1%
[
5.5%
-
6.0%
]
5.95%
70,1972.7%
[
6.0%
-
6.5%
]
6.15%
26,1412.6%
[
6.0%
-
6.5%
]
6.37%
5,9052.7%
[
6.5%
-
7.0%
]
6.51%
123,1352.3%
[
6.5%
-
7.0%
]
6.75%
47,9673.3%
[
7.0%
-
7.5%
]
7.05%
7235.0%
[
7.0%
-
7.5%
]
7.41%
5262.8%
[
7.5%
-
8.0%
]
7.56%
55,8762.2%
[
7.5%
-
8.0%
]
7.95%
5281.9%
[
8.5%
-
9.0%
]
8.88%
116,3041.3%
[
9.0%
-
9.5%
]
9.15%
2,3513.0%
[
9.5%
-
10.0%
]
9.54%
12,0485.6%
[
9.5%
-
10.0%
]
9.83%
2,2998.1%
[
10.5%
-
11.0%
]
10.58%
4,3750.64%
[
10.5%
-
11.0%
]
10.97%
1,0305.0%
[
11.5%
-
12.0%
]
11.89%
14314.0%
[
12.0%
-
12.5%
]
12.00%
1,8751.2%
[
13.5%
-
14.0%
]
13.85%
11,7572.0%
[
14.0%
-
14.5%
]
14.44%
2,3480.50%
[
15.5%
-
16.0%
]
15.99%
3,9144.1%
[
16.0%
-
16.5%
]
16.48%
1823.4%
[
18.5%
-
19.0%
]
18.91%
5,3314.6%